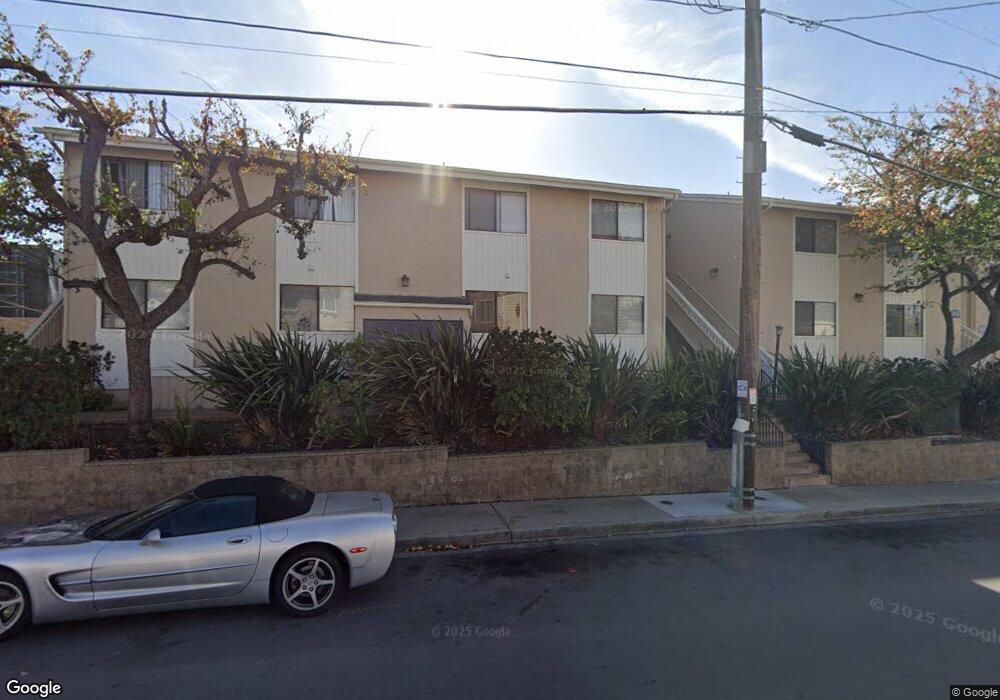
5655 Riley St Unit 207 San Diego, CA 92110
Morena NeighborhoodEstimated Value: $428,000 - $488,000
1
Bed
1
Bath
663
Sq Ft
$682/Sq Ft
Est. Value
About This Home
This home is located at 5655 Riley St Unit 207, San Diego, CA 92110 and is currently estimated at $452,218, approximately $682 per square foot. 5655 Riley St Unit 207 is a home located in San Diego County with nearby schools including Carson Elementary School, Montgomery Middle School, and Empower Language Academy.
Ownership History
Date
Name
Owned For
Owner Type
Purchase Details
Closed on
Jul 12, 2018
Sold by
Graham Gary W
Bought by
Graham Gary W
Current Estimated Value
Purchase Details
Closed on
Feb 27, 1987
Sold by
Graham Karen M
Bought by
Graham Gary W and Graham Anne Penny
Create a Home Valuation Report for This Property
The Home Valuation Report is an in-depth analysis detailing your home's value as well as a comparison with similar homes in the area
Home Values in the Area
Average Home Value in this Area
Purchase History
| Date | Buyer | Sale Price | Title Company |
|---|---|---|---|
| Graham Gary W | -- | None Available | |
| Graham Gary W | -- | -- |
Source: Public Records
Tax History Compared to Growth
Tax History
| Year | Tax Paid | Tax Assessment Tax Assessment Total Assessment is a certain percentage of the fair market value that is determined by local assessors to be the total taxable value of land and additions on the property. | Land | Improvement |
|---|---|---|---|---|
| 2025 | $1,224 | $98,990 | $39,058 | $59,932 |
| 2024 | $1,224 | $97,050 | $38,293 | $58,757 |
| 2023 | $1,197 | $95,148 | $37,543 | $57,605 |
| 2022 | $1,165 | $93,283 | $36,807 | $56,476 |
| 2021 | $1,157 | $91,455 | $36,086 | $55,369 |
| 2020 | $1,144 | $90,518 | $35,716 | $54,802 |
| 2019 | $1,124 | $88,744 | $35,016 | $53,728 |
| 2018 | $1,052 | $87,005 | $34,330 | $52,675 |
| 2017 | $1,027 | $85,300 | $33,657 | $51,643 |
| 2016 | $1,010 | $83,629 | $32,998 | $50,631 |
| 2015 | $996 | $82,374 | $32,503 | $49,871 |
| 2014 | $981 | $80,762 | $31,867 | $48,895 |
Source: Public Records
Map
Nearby Homes
- 5653 Riley St Unit 105
- 5649 Lauretta St
- 5727 Lauretta St
- 5747 Lauretta St
- 1124 Eureka St Unit 28
- 1124 Eureka St Unit 16
- 5621 Mildred St
- 1069 Donahue St
- 5520 Riley St
- 5725 Linda Vista Rd Unit 4
- 5705 Friars Rd Unit 19
- 6055 Cirrus St
- 5645 Friars Rd Unit 386
- 5605 Friars Rd Unit 270
- 5645 Friars Rd Unit 381
- 5645 Friars Rd Unit 370
- 5605 Friars Rd Unit 323
- 5645 Friars Rd Unit 363
- 5605 Friars Rd Unit 274
- 5605 Friars Rd Unit 288
- 5655 Riley St
- 5657 Riley St
- 5655 Riley St Unit 208
- 5655 Riley St Unit 206
- 5655 Riley St Unit 205
- 5655 Riley St Unit 204
- 5655 Riley St Unit 203
- 5655 Riley St Unit 202
- 5655 Riley St Unit 201
- 5653 Riley St Unit 106
- 5653 Riley St Unit 104
- 5653 Riley St Unit 103
- 5653 Riley St Unit 102
- 5653 Riley St Unit 101
- 5657 Riley St Unit 304
- 5657 Riley St Unit 303
- 5657 Riley St Unit 302
- 5657 Riley St Unit 301
- 5637 Riley St
- 5664 Gaines St Unit 68