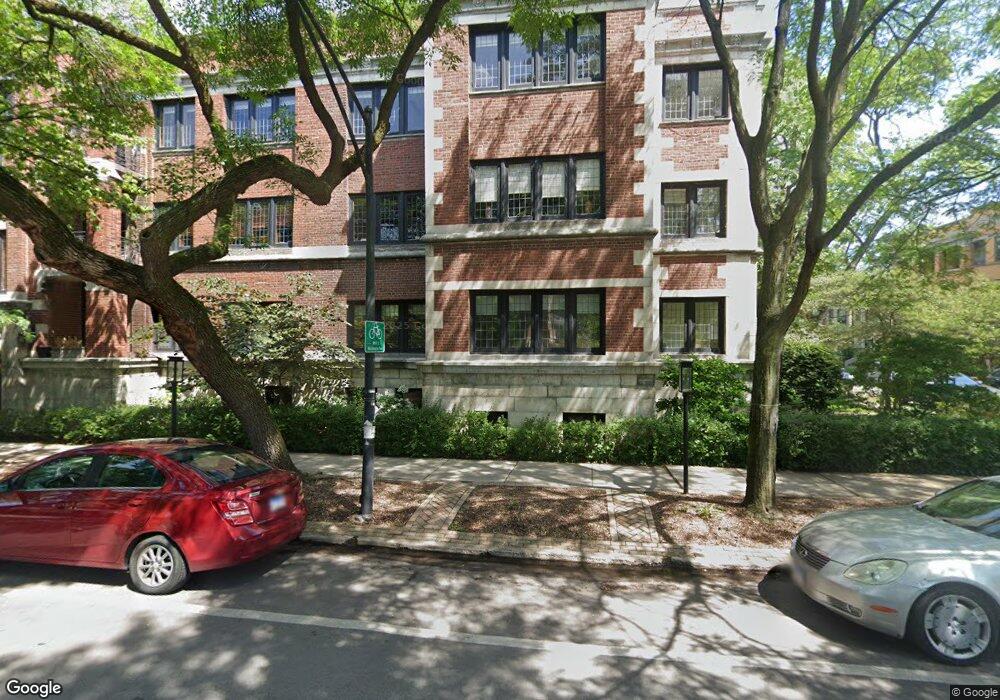
5656 S Dorchester Ave Unit 5656 Chicago, IL 60637
Hyde Park NeighborhoodEstimated Value: $209,686 - $227,000
--
Bed
--
Bath
--
Sq Ft
0.6
Acres
About This Home
This home is located at 5656 S Dorchester Ave Unit 5656, Chicago, IL 60637 and is currently estimated at $218,172. 5656 S Dorchester Ave Unit 5656 is a home located in Cook County with nearby schools including Ray Elementary School, Kenwood Academy High School, and St. Thomas the Apostle Elementary School.
Ownership History
Date
Name
Owned For
Owner Type
Purchase Details
Closed on
Jul 24, 2019
Sold by
Ameriks Kevin A and Ameriks Mary H
Bought by
Murray Alanna
Current Estimated Value
Home Financials for this Owner
Home Financials are based on the most recent Mortgage that was taken out on this home.
Original Mortgage
$149,000
Outstanding Balance
$130,671
Interest Rate
3.87%
Mortgage Type
New Conventional
Estimated Equity
$87,501
Purchase Details
Closed on
Oct 11, 2011
Sold by
Ameriks Karl and Ameriks Geraldine
Bought by
Ameriks Kevin A and Ameriks Mary H
Purchase Details
Closed on
Apr 13, 2002
Sold by
Frierson Patrick R and Kim Katheryn K
Bought by
Ameriks Karl and Ameriks Geraldine
Purchase Details
Closed on
Oct 14, 1996
Sold by
Nahl Angela B
Bought by
Frierson Patrick R and Kim Katheryn K
Home Financials for this Owner
Home Financials are based on the most recent Mortgage that was taken out on this home.
Original Mortgage
$50,400
Interest Rate
8.32%
Mortgage Type
Balloon
Create a Home Valuation Report for This Property
The Home Valuation Report is an in-depth analysis detailing your home's value as well as a comparison with similar homes in the area
Home Values in the Area
Average Home Value in this Area
Purchase History
| Date | Buyer | Sale Price | Title Company |
|---|---|---|---|
| Murray Alanna | $185,000 | Chicago Title | |
| Ameriks Kevin A | -- | Chicago Title Insurance Co | |
| Ameriks Karl | $73,000 | Chicago Title Insurance Co | |
| Frierson Patrick R | $56,000 | -- |
Source: Public Records
Mortgage History
| Date | Status | Borrower | Loan Amount |
|---|---|---|---|
| Open | Murray Alanna | $149,000 | |
| Previous Owner | Frierson Patrick R | $50,400 |
Source: Public Records
Tax History Compared to Growth
Tax History
| Year | Tax Paid | Tax Assessment Tax Assessment Total Assessment is a certain percentage of the fair market value that is determined by local assessors to be the total taxable value of land and additions on the property. | Land | Improvement |
|---|---|---|---|---|
| 2024 | $2,329 | $11,818 | $2,586 | $9,232 |
| 2023 | $2,262 | $11,000 | $2,085 | $8,915 |
| 2022 | $2,262 | $11,000 | $2,085 | $8,915 |
| 2021 | $2,212 | $10,999 | $2,085 | $8,914 |
| 2020 | $2,290 | $10,281 | $1,668 | $8,613 |
| 2019 | $1,561 | $11,197 | $1,668 | $9,529 |
| 2018 | $1,533 | $11,197 | $1,668 | $9,529 |
| 2017 | $1,385 | $9,807 | $1,376 | $8,431 |
| 2016 | $1,464 | $9,807 | $1,376 | $8,431 |
| 2015 | $1,316 | $9,807 | $1,376 | $8,431 |
| 2014 | $1,696 | $11,711 | $1,126 | $10,585 |
| 2013 | $2,130 | $11,711 | $1,126 | $10,585 |
Source: Public Records
Map
Nearby Homes
- 1366 E 57th St Unit 3
- 5656 S Dorchester Ave Unit B
- 5716 S Kenwood Ave Unit 1
- 5611 S Kenwood Ave
- 5714 S Kenwood Ave Unit 1
- 5707 S Blackstone Ave Unit 2
- 5741 S Kenwood Ave Unit 3
- 1424 E 58th St Unit 3
- 1302 E 56th St Unit 3
- 5616 S Harper Ave
- 5712 S Dorchester Ave Unit 1
- 1308 E 56th St Unit 2
- 1300 E 56th St Unit G
- 5729 S Harper Ave
- 5517 S Dorchester Ave
- 1452 E Park Place
- 1400 E 55th Place Unit 702S
- 1450 E 55th Place Unit 930S
- 1450 E 55th Place Unit 317S
- 1450 E 55th Place Unit 230S
- 5656 S Dorchester Ave Unit 5656
- 5656 S Dorchester Ave Unit 1374
- 5656 S Dorchester Ave Unit 5656
- 5656 S Dorchester Ave Unit 5656
- 5656 S Dorchester Ave Unit 1
- 5656 S Dorchester Ave Unit 3
- 5656 S Dorchester Ave Unit 2
- 5650 S Dorchester Ave Unit 5650
- 5650 S Dorchester Ave Unit 5650
- 5650 S Dorchester Ave Unit 2
- 5650 S Dorchester Ave Unit 3
- 5632 S Dorchester Ave
- 5638 S Dorchester Ave
- 5628 S Dorchester Ave
- 5642 S Dorchester Ave
- 5626 S Dorchester Ave Unit 4
- 5626 S Dorchester Ave Unit 5
- 5626 S Dorchester Ave Unit 1
- 5637 S Dorchester Ave Unit 1