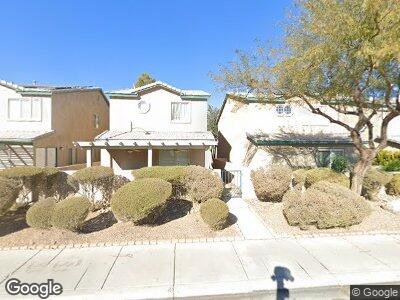
5657 Ritter Ln Las Vegas, NV 89118
Spring Valley NeighborhoodEstimated Value: $308,000 - $340,269
2
Beds
3
Baths
1,265
Sq Ft
$255/Sq Ft
Est. Value
About This Home
This home is located at 5657 Ritter Ln, Las Vegas, NV 89118 and is currently estimated at $322,567, approximately $254 per square foot. 5657 Ritter Ln is a home located in Clark County with nearby schools including Helen Jydstrup Elementary School, Grant Sawyer Middle School, and Durango High School.
Ownership History
Date
Name
Owned For
Owner Type
Purchase Details
Closed on
Aug 9, 2018
Sold by
Deperio Delia Gay
Bought by
He Kunhai
Current Estimated Value
Home Financials for this Owner
Home Financials are based on the most recent Mortgage that was taken out on this home.
Original Mortgage
$168,000
Interest Rate
4.5%
Mortgage Type
New Conventional
Purchase Details
Closed on
Mar 21, 2013
Sold by
White Edward M
Bought by
Deperio Delia Gay
Home Financials for this Owner
Home Financials are based on the most recent Mortgage that was taken out on this home.
Original Mortgage
$58,500
Interest Rate
3.49%
Mortgage Type
New Conventional
Purchase Details
Closed on
Nov 10, 2004
Sold by
In Between Group
Bought by
White Edward M
Home Financials for this Owner
Home Financials are based on the most recent Mortgage that was taken out on this home.
Original Mortgage
$168,000
Interest Rate
5.87%
Mortgage Type
Unknown
Purchase Details
Closed on
Oct 10, 1994
Sold by
Chartered Realty Partners Iii
Bought by
In Between Group
Create a Home Valuation Report for This Property
The Home Valuation Report is an in-depth analysis detailing your home's value as well as a comparison with similar homes in the area
Home Values in the Area
Average Home Value in this Area
Purchase History
| Date | Buyer | Sale Price | Title Company |
|---|---|---|---|
| He Kunhai | $210,000 | Ticor Title Las Vegas 8 | |
| Deperio Delia Gay | $78,000 | Neveda Title Las Vegas | |
| White Edward M | $210,000 | Old Republic Title Co Of Nv | |
| In Between Group | $93,500 | United Title |
Source: Public Records
Mortgage History
| Date | Status | Borrower | Loan Amount |
|---|---|---|---|
| Open | He Kunhai | $255,000 | |
| Closed | He Kunhai | $55,000 | |
| Closed | He Kunhai | $168,000 | |
| Previous Owner | Deperio Delia Gay | $58,500 | |
| Previous Owner | White Edward M | $168,000 | |
| Closed | White Edward M | $42,000 |
Source: Public Records
Tax History Compared to Growth
Tax History
| Year | Tax Paid | Tax Assessment Tax Assessment Total Assessment is a certain percentage of the fair market value that is determined by local assessors to be the total taxable value of land and additions on the property. | Land | Improvement |
|---|---|---|---|---|
| 2025 | $1,198 | $71,965 | $28,000 | $43,965 |
| 2024 | $1,164 | $71,965 | $28,000 | $43,965 |
| 2023 | $1,164 | $69,847 | $28,000 | $41,847 |
| 2022 | $1,130 | $59,370 | $21,000 | $38,370 |
| 2021 | $1,097 | $57,653 | $21,000 | $36,653 |
| 2020 | $1,062 | $55,682 | $19,250 | $36,432 |
| 2019 | $1,031 | $52,070 | $16,100 | $35,970 |
| 2018 | $1,001 | $46,848 | $12,250 | $34,598 |
| 2017 | $1,349 | $45,724 | $10,850 | $34,874 |
| 2016 | $938 | $44,495 | $9,450 | $35,045 |
| 2015 | $935 | $36,082 | $5,250 | $30,832 |
| 2014 | $906 | $32,294 | $5,250 | $27,044 |
Source: Public Records
Map
Nearby Homes
- 5253 Westwind Rd
- 5588 Ness Ave
- 5273 Wave Dancer Ln
- 5564 Ness Ave
- 5771 Ritter Ln
- 5516 Ness Ave
- 5261 Lindell Rd Unit 205
- 5211 Lindell Rd Unit 207
- 5612 Coder Ct
- 5221 Tropical Peach Dr
- 5615 Calais Ct
- 5256 Harvest Breeze Rd
- 5161 Lindell Rd Unit 201
- 5461 Dungaree St
- 5359 Harvest Breeze Rd
- 5130 S Jones Blvd Unit 108
- 5130 S Jones Blvd Unit 203
- 5384 Hanging Tree Ln
- 5138 S Jones Blvd Unit 207
- 5150 S Jones Blvd Unit 105
- 5657 Ritter Ln
- 5651 Ritter Ln Unit 2
- 5645 Ritter Ln
- 5669 Ritter Ln
- 5277 Westwind Rd
- 5675 Ritter Ln
- 5278 Sacha Way
- 5633 Ritter Ln
- 5271 Westwind Rd
- 5274 Sacha Way
- 5627 Ritter Ln
- 5267 Westwind Rd
- 5270 Sacha Way
- 5275 Souvenir Ln
- 5621 Ritter Ln
- 5263 Westwind Rd Unit 2
- 5699 Ritter Ln
- 5668 Ness Ave
- 5660 Ness Ave
- 5660 Ness Ave Unit 1