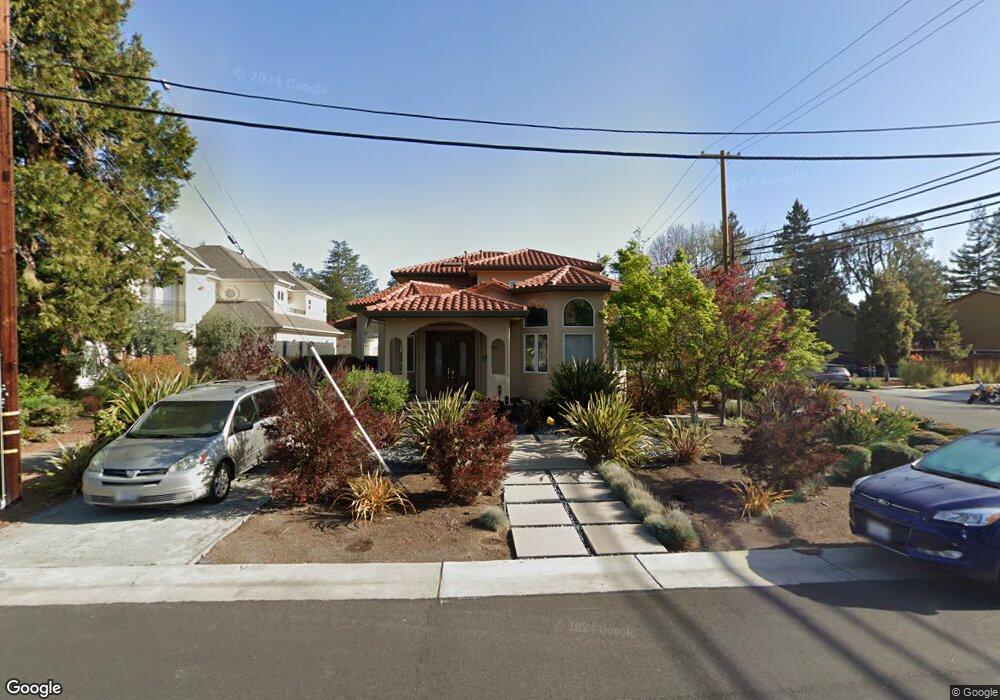
566 Maybell Ave Palo Alto, CA 94306
Barron Park NeighborhoodEstimated Value: $5,067,633 - $6,912,000
4
Beds
5
Baths
4,174
Sq Ft
$1,435/Sq Ft
Est. Value
About This Home
This home is located at 566 Maybell Ave, Palo Alto, CA 94306 and is currently estimated at $5,989,408, approximately $1,434 per square foot. 566 Maybell Ave is a home located in Santa Clara County with nearby schools including Juana Briones Elementary School, Ellen Fletcher Middle, and Henry M. Gunn High School.
Ownership History
Date
Name
Owned For
Owner Type
Purchase Details
Closed on
Jul 26, 2011
Sold by
Chin Harry and Soohoo Lisa
Bought by
Lee Peter I and Aslan Andrea
Current Estimated Value
Home Financials for this Owner
Home Financials are based on the most recent Mortgage that was taken out on this home.
Original Mortgage
$1,706,250
Outstanding Balance
$1,125,434
Interest Rate
3.58%
Mortgage Type
New Conventional
Estimated Equity
$4,863,974
Purchase Details
Closed on
Oct 9, 2006
Sold by
Chin Harry
Bought by
Chin Harry and Soohoo Lisa
Home Financials for this Owner
Home Financials are based on the most recent Mortgage that was taken out on this home.
Original Mortgage
$1,500,000
Interest Rate
6.37%
Mortgage Type
New Conventional
Purchase Details
Closed on
Jan 12, 1999
Sold by
Jacobson Virginia C Trust
Bought by
Chin Harry
Home Financials for this Owner
Home Financials are based on the most recent Mortgage that was taken out on this home.
Original Mortgage
$240,000
Interest Rate
6.63%
Create a Home Valuation Report for This Property
The Home Valuation Report is an in-depth analysis detailing your home's value as well as a comparison with similar homes in the area
Home Values in the Area
Average Home Value in this Area
Purchase History
| Date | Buyer | Sale Price | Title Company |
|---|---|---|---|
| Lee Peter I | $2,274,750 | Chicago Title Company | |
| Chin Harry | -- | Commerce Title Company | |
| Chin Harry | -- | Chicago Title Co |
Source: Public Records
Mortgage History
| Date | Status | Borrower | Loan Amount |
|---|---|---|---|
| Open | Lee Peter I | $1,706,250 | |
| Previous Owner | Chin Harry | $1,500,000 | |
| Previous Owner | Chin Harry | $240,000 |
Source: Public Records
Tax History Compared to Growth
Tax History
| Year | Tax Paid | Tax Assessment Tax Assessment Total Assessment is a certain percentage of the fair market value that is determined by local assessors to be the total taxable value of land and additions on the property. | Land | Improvement |
|---|---|---|---|---|
| 2025 | $33,835 | $2,857,517 | $1,384,796 | $1,472,721 |
| 2024 | $33,835 | $2,801,489 | $1,357,644 | $1,443,845 |
| 2023 | $33,336 | $2,746,559 | $1,331,024 | $1,415,535 |
| 2022 | $32,950 | $2,692,706 | $1,304,926 | $1,387,780 |
| 2021 | $32,300 | $2,639,909 | $1,279,340 | $1,360,569 |
| 2020 | $31,631 | $2,612,841 | $1,266,222 | $1,346,619 |
| 2019 | $31,282 | $2,561,610 | $1,241,395 | $1,320,215 |
| 2018 | $30,419 | $2,511,383 | $1,217,054 | $1,294,329 |
| 2017 | $29,884 | $2,462,141 | $1,193,191 | $1,268,950 |
| 2016 | $29,101 | $2,413,865 | $1,169,796 | $1,244,069 |
| 2015 | $28,818 | $2,377,607 | $1,152,225 | $1,225,382 |
| 2014 | $28,247 | $2,331,034 | $1,129,655 | $1,201,379 |
Source: Public Records
Map
Nearby Homes
- 4132 Thain Way
- 645 Maybell Ave Unit A
- 4198 Cherry Oaks Place
- 717 Los Robles Ave
- 4250 El Camino Real Unit B120
- 579 Glenbrook Dr
- 4287 Pomona Ave
- 923 Shauna Ln
- 342 Carolina Ln
- 3888 Magnolia Dr
- 4163 Park Blvd
- 4225 Park Blvd
- 26 Roosevelt Cir
- 4388 El Camino Real Unit 388
- 278 Monroe Dr Unit 35
- 715 Matadero Ave
- 110 Greenmeadow Way Unit 10
- 3585 El Camino Real
- 3638 Bryant St
- 995 Matadero Ave
- 4163 Abel Ave
- 4155 Abel Ave
- 567 Maybell Ave
- 564 Maybell Ave
- 4158 Baker Ave
- 570 Maybell Ave
- 575 Maybell Ave
- 4151 Abel Ave
- 569 Maybell Ave
- 4152 Baker Ave
- 575 Maybell Ave
- 4135 Orchard Ct
- 576 Maybell Ave
- 4148 Baker Ave
- 4143 Abel Ave
- 587 Maybell Ave
- 4142 Baker Ave
- 578 Maybell Ave
- 4139 Orchard Ct
- 4137 Abel Ave