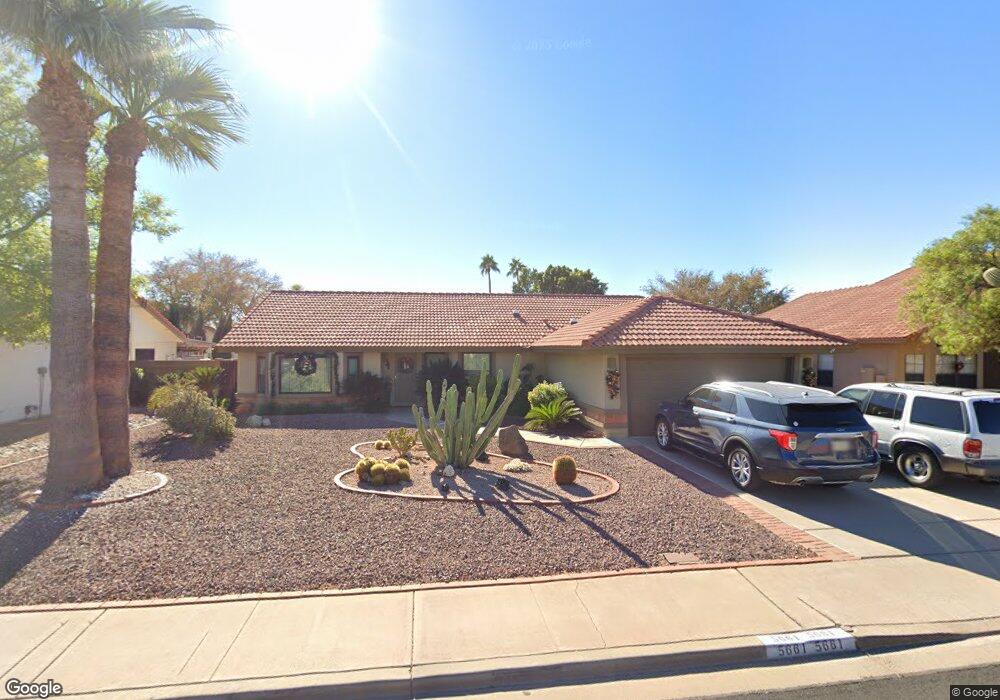
5661 E Fox St Mesa, AZ 85205
Central Mesa East NeighborhoodEstimated Value: $474,205 - $537,000
4
Beds
2
Baths
2,003
Sq Ft
$258/Sq Ft
Est. Value
About This Home
This home is located at 5661 E Fox St, Mesa, AZ 85205 and is currently estimated at $516,301, approximately $257 per square foot. 5661 E Fox St is a home located in Maricopa County with nearby schools including Mendoza Elementary School, Franklin at Brimhall Elementary School, and Franklin West Elementary School.
Ownership History
Date
Name
Owned For
Owner Type
Purchase Details
Closed on
Mar 16, 2010
Sold by
Kornoelje James
Bought by
Meyer Raymond P and Meyer Merrill A
Current Estimated Value
Home Financials for this Owner
Home Financials are based on the most recent Mortgage that was taken out on this home.
Original Mortgage
$190,000
Outstanding Balance
$126,054
Interest Rate
5%
Mortgage Type
VA
Estimated Equity
$390,247
Purchase Details
Closed on
Mar 18, 2002
Sold by
Reed Peter C
Bought by
Kornoelje James and Kornoelje Patricia
Purchase Details
Closed on
Jul 22, 1999
Sold by
Reed Peter C and Reed Shirley J
Bought by
Reed Peter C and Reed Shirley J
Purchase Details
Closed on
Apr 20, 1999
Sold by
Taylor Jay A
Bought by
Reed Peter C and Reed Shirley J
Home Financials for this Owner
Home Financials are based on the most recent Mortgage that was taken out on this home.
Original Mortgage
$40,000
Interest Rate
6.84%
Mortgage Type
New Conventional
Create a Home Valuation Report for This Property
The Home Valuation Report is an in-depth analysis detailing your home's value as well as a comparison with similar homes in the area
Home Values in the Area
Average Home Value in this Area
Purchase History
| Date | Buyer | Sale Price | Title Company |
|---|---|---|---|
| Meyer Raymond P | $190,000 | Chicago Title | |
| Kornoelje James | $176,000 | Title Guaranty Agency | |
| Reed Peter C | -- | -- | |
| Reed Peter C | $161,000 | Security Title Agency |
Source: Public Records
Mortgage History
| Date | Status | Borrower | Loan Amount |
|---|---|---|---|
| Open | Meyer Raymond P | $190,000 | |
| Previous Owner | Reed Peter C | $40,000 |
Source: Public Records
Tax History
| Year | Tax Paid | Tax Assessment Tax Assessment Total Assessment is a certain percentage of the fair market value that is determined by local assessors to be the total taxable value of land and additions on the property. | Land | Improvement |
|---|---|---|---|---|
| 2025 | $2,031 | $24,458 | -- | -- |
| 2024 | $2,053 | $23,293 | -- | -- |
| 2023 | $2,053 | $39,380 | $7,870 | $31,510 |
| 2022 | $2,008 | $29,750 | $5,950 | $23,800 |
| 2021 | $2,063 | $26,600 | $5,320 | $21,280 |
| 2020 | $2,036 | $25,260 | $5,050 | $20,210 |
| 2019 | $1,886 | $24,150 | $4,830 | $19,320 |
| 2018 | $1,801 | $22,560 | $4,510 | $18,050 |
| 2017 | $1,744 | $21,680 | $4,330 | $17,350 |
| 2016 | $1,712 | $21,160 | $4,230 | $16,930 |
| 2015 | $1,617 | $20,210 | $4,040 | $16,170 |
Source: Public Records
Map
Nearby Homes
- 5651 E Fairfield St
- 5757 E Fox St
- 5703 E Greenway St
- 1038 N Alvaro
- 5552 E Enrose St
- 1235 N Sunnyvale Unit 93
- 5403 E Greenway St
- 5829 E Enrose St
- 1340 N Recker Rd Unit 109
- 1340 N Recker Rd Unit 343
- 1340 N Recker Rd Unit 209
- 1340 N Recker Rd Unit 323
- 832 N Alvaro Cir
- 840 N Arvada
- 5822 E Duncan St
- 5704 E Dodge St
- 5853 E Adobe Rd
- 5963 E Enrose Cir
- 5255 E Greenway Cir
- 5862 E Duncan St
- 5655 E Fox St
- 5701 E Fox St
- 1052 N Abner
- 5647 E Fox St
- 5638 E Fairfield St
- 5630 E Fairfield St
- 5660 E Fox St
- 5652 E Fox St
- 5646 E Fairfield St
- 5702 E Fox St
- 5639 E Fox St
- 5644 E Fox St
- 5654 E Fairfield St
- 5622 E Fairfield St
- 5710 E Fox St
- 5631 E Fox St
- 1059 N Abner
- 5636 E Fox St
- 5665 E Fairbrook St
- 1111 N Abner
Your Personal Tour Guide
Ask me questions while you tour the home.