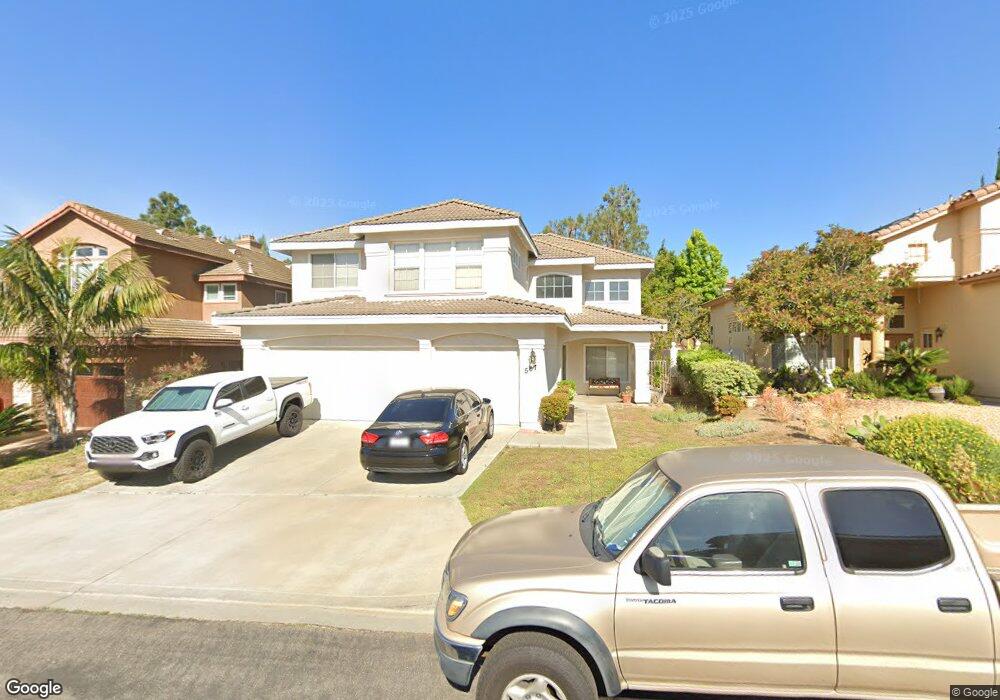
567 Bayona Loop Chula Vista, CA 91910
Rancho Del Rey NeighborhoodEstimated Value: $1,141,132 - $1,222,000
5
Beds
3
Baths
2,570
Sq Ft
$462/Sq Ft
Est. Value
About This Home
This home is located at 567 Bayona Loop, Chula Vista, CA 91910 and is currently estimated at $1,188,533, approximately $462 per square foot. 567 Bayona Loop is a home located in San Diego County with nearby schools including Bonita Vista Middle School, Bonita Vista Senior High School, and Discovery Charter School.
Ownership History
Date
Name
Owned For
Owner Type
Purchase Details
Closed on
Feb 22, 2021
Sold by
Almodovar Juan Esperanza
Bought by
Juan Family Trust and Juan
Current Estimated Value
Purchase Details
Closed on
Jun 12, 2003
Sold by
Juan Dominador and Juan Esperanza A
Bought by
Juan Dominador and Juan Esperanza A
Home Financials for this Owner
Home Financials are based on the most recent Mortgage that was taken out on this home.
Original Mortgage
$208,500
Interest Rate
5.61%
Mortgage Type
Unknown
Purchase Details
Closed on
Jun 6, 2003
Sold by
Juan Dominador and Juan Esperanza A
Bought by
Juan Dominador and Juan Esperanza A
Home Financials for this Owner
Home Financials are based on the most recent Mortgage that was taken out on this home.
Original Mortgage
$208,500
Interest Rate
5.61%
Mortgage Type
Unknown
Purchase Details
Closed on
Jan 5, 2000
Sold by
Juan Dominador A and Juan Esperanza A
Bought by
Juan Dominador and Juan Esperanza A
Purchase Details
Closed on
Jul 27, 1994
Sold by
Shea Homes Ltd Partnership
Bought by
Juan Dominador and Juan Esperanza A
Home Financials for this Owner
Home Financials are based on the most recent Mortgage that was taken out on this home.
Original Mortgage
$213,700
Interest Rate
8.1%
Create a Home Valuation Report for This Property
The Home Valuation Report is an in-depth analysis detailing your home's value as well as a comparison with similar homes in the area
Home Values in the Area
Average Home Value in this Area
Purchase History
| Date | Buyer | Sale Price | Title Company |
|---|---|---|---|
| Juan Family Trust | -- | -- | |
| Juan Dominador | -- | -- | |
| Juan Dominador | -- | -- | |
| Juan Dominador | -- | -- | |
| Juan Dominador | $251,500 | Chicago Title Co |
Source: Public Records
Mortgage History
| Date | Status | Borrower | Loan Amount |
|---|---|---|---|
| Previous Owner | Juan Dominador | $208,500 | |
| Previous Owner | Juan Dominador | $213,700 |
Source: Public Records
Tax History Compared to Growth
Tax History
| Year | Tax Paid | Tax Assessment Tax Assessment Total Assessment is a certain percentage of the fair market value that is determined by local assessors to be the total taxable value of land and additions on the property. | Land | Improvement |
|---|---|---|---|---|
| 2025 | $5,294 | $422,414 | $121,761 | $300,653 |
| 2024 | $5,294 | $414,132 | $119,374 | $294,758 |
| 2023 | $5,195 | $406,013 | $117,034 | $288,979 |
| 2022 | $5,042 | $398,053 | $114,740 | $283,313 |
| 2021 | $4,929 | $390,249 | $112,491 | $277,758 |
| 2020 | $4,820 | $386,248 | $111,338 | $274,910 |
| 2019 | $6,352 | $378,675 | $109,155 | $269,520 |
| 2018 | $6,230 | $371,251 | $107,015 | $264,236 |
| 2017 | $6,111 | $363,972 | $104,917 | $259,055 |
| 2016 | $5,942 | $356,836 | $102,860 | $253,976 |
| 2015 | $5,822 | $351,477 | $101,315 | $250,162 |
| 2014 | $5,734 | $344,593 | $99,331 | $245,262 |
Source: Public Records
Map
Nearby Homes
- 475 Acero Place Unit none
- 728 Cardona Ave
- 713 Esla Dr
- 1006 Acero St
- 0 Otay Lakes Rd Unit PTP2505558
- 1334 Ridgeview Way
- 1349 Ridgeview Way
- 1370 Callejon Palacios Unit 61
- 575 Otay Lakes Rd Unit 44
- 1386 Serena Cir Unit 2
- 1415 Summit Dr
- 1112 Camino Del Rey
- 363 Surrey Dr
- 743 Terra Nova Dr
- 4631 Villas Ct
- 3928 La Cresta Way
- 1029 Vista Oak Place
- 4521 Villas Dr
- 4614 Villas Dr
- 4600 Villas Dr
- 565 Bayona Loop
- 579 Bayona Loop
- 563 Bayona Loop
- 581 Bayona Loop
- 1107 Los Indios Ct
- 1106 Los Indios Ct
- 583 Bayona Loop
- 561 Bayona Loop
- 1105 Los Indios Ct
- 1101 Corrales Ln
- 1100 Calle Florecita
- 585 Bayona Loop
- 559 Bayona Loop
- 1105 Corrales Ln
- 1104 Calle Florecita
- 1104 Los Indios Ct
- 1114 Princesa Ct
- 1103 Los Indios Ct
- 1116 Princesa Ct
- 587 Bayona Loop