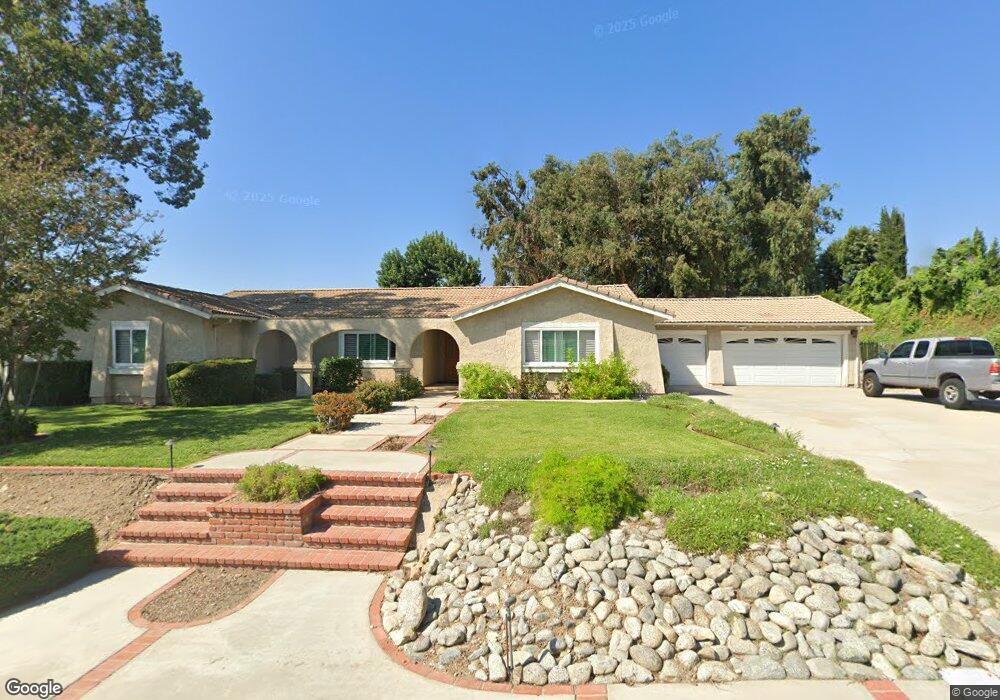
5678 Klusman Ave Rancho Cucamonga, CA 91737
Estimated Value: $990,859 - $1,248,000
4
Beds
3
Baths
2,270
Sq Ft
$506/Sq Ft
Est. Value
About This Home
This home is located at 5678 Klusman Ave, Rancho Cucamonga, CA 91737 and is currently estimated at $1,148,215, approximately $505 per square foot. 5678 Klusman Ave is a home located in San Bernardino County with nearby schools including Floyd M. Stork Elementary, Alta Loma Junior High, and Los Osos High.
Ownership History
Date
Name
Owned For
Owner Type
Purchase Details
Closed on
Mar 3, 2016
Sold by
Vanrooy Anna M and Vanrooy Van Rooy
Bought by
Vanrooy Anna M and Vanrooy Van Rooy
Current Estimated Value
Home Financials for this Owner
Home Financials are based on the most recent Mortgage that was taken out on this home.
Original Mortgage
$203,400
Interest Rate
3.44%
Mortgage Type
New Conventional
Purchase Details
Closed on
Jan 21, 2016
Sold by
Vanrooy Anna M
Bought by
Vanrooy Anna M and Vanrooy Van Rooy
Home Financials for this Owner
Home Financials are based on the most recent Mortgage that was taken out on this home.
Original Mortgage
$203,400
Interest Rate
3.44%
Mortgage Type
New Conventional
Purchase Details
Closed on
Oct 28, 2010
Sold by
Vanrooy Andrew
Bought by
Vanrooy Anna M
Purchase Details
Closed on
Jan 17, 2006
Sold by
Vanrooy Anna Maria and Vanrooy Van Rooy
Bought by
Vanrooy Andrew
Home Financials for this Owner
Home Financials are based on the most recent Mortgage that was taken out on this home.
Original Mortgage
$250,000
Interest Rate
6.28%
Mortgage Type
New Conventional
Purchase Details
Closed on
Oct 24, 2002
Sold by
Vanroy Anna Maria
Bought by
Vanroy Anna Maria and Vanroy Andrew
Create a Home Valuation Report for This Property
The Home Valuation Report is an in-depth analysis detailing your home's value as well as a comparison with similar homes in the area
Home Values in the Area
Average Home Value in this Area
Purchase History
| Date | Buyer | Sale Price | Title Company |
|---|---|---|---|
| Vanrooy Anna M | -- | Wfg Lender Services | |
| Vanrooy Anna M | -- | None Available | |
| Vanrooy Anna M | -- | None Available | |
| Vanrooy Andrew | -- | Financial Title | |
| Vanroy Anna Maria | -- | -- |
Source: Public Records
Mortgage History
| Date | Status | Borrower | Loan Amount |
|---|---|---|---|
| Closed | Vanrooy Anna M | $203,400 | |
| Closed | Vanrooy Andrew | $250,000 |
Source: Public Records
Tax History Compared to Growth
Tax History
| Year | Tax Paid | Tax Assessment Tax Assessment Total Assessment is a certain percentage of the fair market value that is determined by local assessors to be the total taxable value of land and additions on the property. | Land | Improvement |
|---|---|---|---|---|
| 2025 | $2,609 | $238,263 | $65,316 | $172,947 |
| 2024 | $2,609 | $233,591 | $64,035 | $169,556 |
| 2023 | $2,551 | $229,010 | $62,779 | $166,231 |
| 2022 | $2,544 | $224,520 | $61,548 | $162,972 |
| 2021 | $2,543 | $220,117 | $60,341 | $159,776 |
| 2020 | $2,440 | $217,860 | $59,722 | $158,138 |
| 2019 | $2,467 | $213,588 | $58,551 | $155,037 |
| 2018 | $2,413 | $373,503 | $131,090 | $242,413 |
| 2017 | $4,068 | $366,180 | $128,520 | $237,660 |
| 2016 | $2,242 | $201,267 | $55,174 | $146,093 |
| 2015 | $2,228 | $198,244 | $54,345 | $143,899 |
| 2014 | $2,165 | $194,360 | $53,280 | $141,080 |
Source: Public Records
Map
Nearby Homes
- 9513 Sunflower St
- 9609 Norbrook Dr
- 9655 Norbrook Dr
- 6055 Amethyst Ave
- 5885 Zapata Place
- 9979 Timbermist Ct
- 6155 Klusman Ave
- 9438 La Gloria Dr
- 6036 Eastwood Ave
- 5330 Evening Canyon Way
- 9855 Banyan St
- 9239 Camellia Ct
- 9227 Camellia Ct
- 9230 Camellia Ct
- 9220 Camellia Ct
- 9210 Camellia Ct
- 9209 Camellia Ct
- 9201 Camellia Ct
- 9504 Lemon Ave
- 5338 Falling Tree Ln
- 9588 Wilson Ave
- 5656 Klusman Ave
- 5677 Klusman Ave
- 5730 Klusman Ave
- 5675 Malachite Ave
- 9600 Wilson Ave
- 5655 Klusman Ave
- 5731 Klusman Ave
- 9597 Beechwood Dr
- 5636 Klusman Ave
- 5738 Klusman Ave
- 5731 Malachite Ave
- 9583 Beechwood Dr
- 5739 Malachite Ave
- 5639 Klusman Ave
- 9639 Minter Ct
- 5739 Klusman Ave
- 5752 Klusman Ave
- 5625 Klusman Ave
- 5684 Malachite Ave