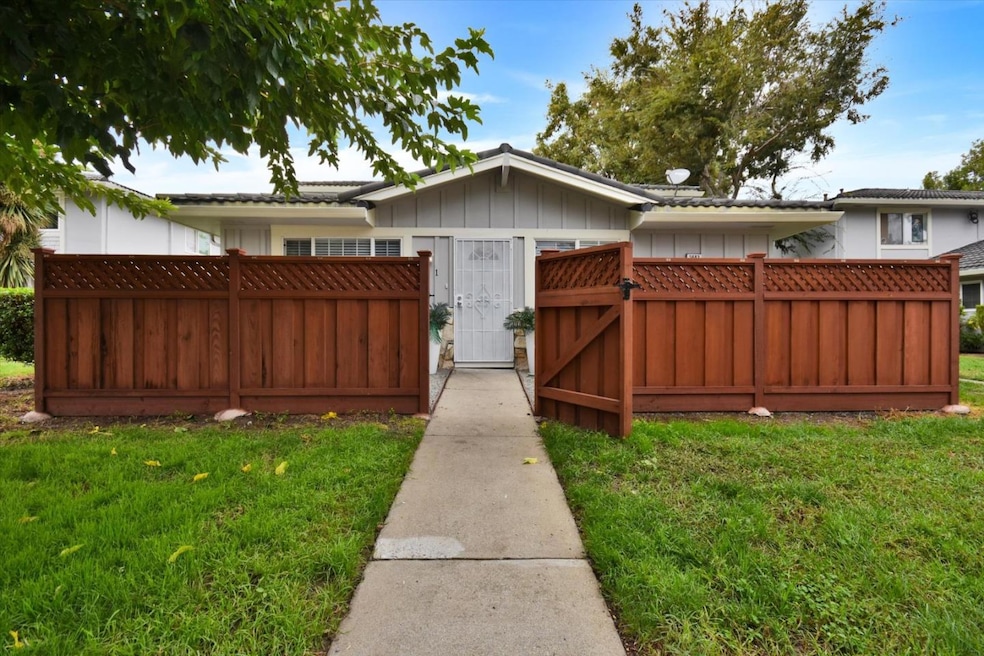
5683 Playa Del Rey Unit 1 San Jose, CA 95123
McKuen NeighborhoodEstimated payment $3,425/month
Highlights
- In Ground Pool
- Solid Surface Bathroom Countertops
- Granite Countertops
- Marble Flooring
- End Unit
- Neighborhood Views
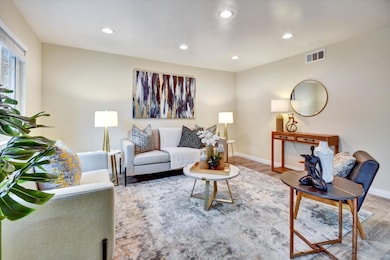
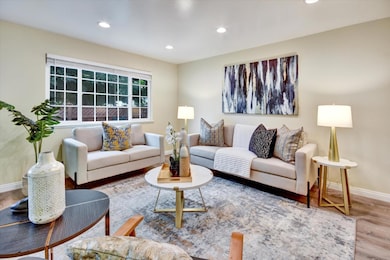
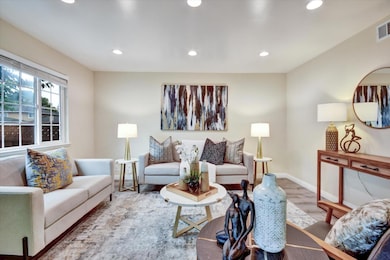
About This Home
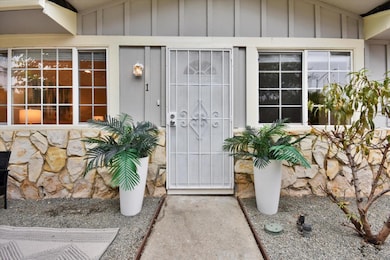
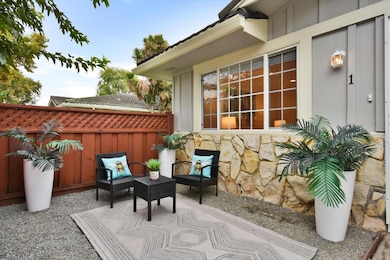
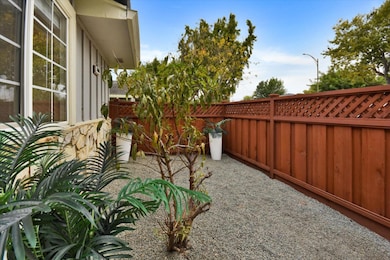
A meticulously updated, bright, 2-bed/1-bath condo offers the perfect blend of comfort and privacy. This cozy, single-level home is elevated to another level by its private, fenced, and gated front yard, a rare find that creates a personal oasis for relaxing and/or entertaining. This move-in-ready, open-concept floor plan features a dining nook and a flexible corner perfect for a home office. The modern kitchen boasts granite countertops, a brand new range+hood, ample storage, in addition to an oversized pantry. This quiet, centrally located complex has $471 HOA dues which cover the pool, fire insurance, water+hot water for the unit, sewer, roof, exterior of the building, landscaping, garbage, and a dedicated laundry room for each building. In the garage area you have a one-car spot in a shared 2 car garage, and a tandem spot behind it, plus two private, lockable storage areas. Desirable schools { C+/A-/B } and many nearby dining options make this a popular neighborhood; this move-in-ready gem is one not to be missed!
Listing Agent
Keller Williams Realty-Silicon Valley License #02049786 Listed on: 10/28/2025

Property Details
Home Type
- Condominium
Est. Annual Taxes
- $2,819
Year Built
- Built in 1970
Lot Details
- End Unit
- East Facing Home
- Wood Fence
- Mostly Level
- Grass Covered Lot
HOA Fees
- $471 Monthly HOA Fees
Parking
- 1 Car Attached Garage
- Tandem Parking
- On-Street Parking
- Assigned Parking
Home Design
- Slab Foundation
- Ceiling Insulation
- Shingle Roof
- Metal Roof
Interior Spaces
- 810 Sq Ft Home
- 1-Story Property
- Double Pane Windows
- Family or Dining Combination
- Neighborhood Views
Kitchen
- Open to Family Room
- Electric Oven
- Range Hood
- Ice Maker
- ENERGY STAR Qualified Appliances
- Granite Countertops
Flooring
- Laminate
- Marble
- Tile
Bedrooms and Bathrooms
- 2 Bedrooms
- Remodeled Bathroom
- 1 Full Bathroom
- Solid Surface Bathroom Countertops
- Dual Flush Toilets
- Bathtub with Shower
Home Security
Outdoor Features
- In Ground Pool
- Balcony
Utilities
- Forced Air Heating System
- Separate Meters
- Individual Gas Meter
Listing and Financial Details
- Assessor Parcel Number 694-21-057
Community Details
Overview
- Association fees include common area electricity, common area gas, exterior painting, garbage, hot water, insurance - common area, insurance - flood, insurance - hazard, insurance - liability, landscaping / gardening, maintenance - common area, maintenance - exterior, pool spa or tennis, roof, sewer, water
- 609 Units
- Downer Estates Association
- Built by Donner Estates
Recreation
- Community Pool
Pet Policy
- Limit on the number of pets
Additional Features
- Laundry Facilities
- Fire and Smoke Detector
Map
Home Values in the Area
Average Home Value in this Area
Tax History
| Year | Tax Paid | Tax Assessment Tax Assessment Total Assessment is a certain percentage of the fair market value that is determined by local assessors to be the total taxable value of land and additions on the property. | Land | Improvement |
|---|---|---|---|---|
| 2025 | $2,819 | $191,666 | $95,833 | $95,833 |
| 2024 | $2,819 | $187,908 | $93,954 | $93,954 |
| 2023 | $2,753 | $184,224 | $92,112 | $92,112 |
| 2022 | $2,748 | $180,612 | $90,306 | $90,306 |
| 2021 | $2,684 | $177,072 | $88,536 | $88,536 |
| 2020 | $2,644 | $175,258 | $87,629 | $87,629 |
| 2019 | $2,595 | $171,822 | $85,911 | $85,911 |
| 2018 | $2,569 | $168,454 | $84,227 | $84,227 |
| 2017 | $2,546 | $165,152 | $82,576 | $82,576 |
| 2016 | $2,430 | $161,914 | $80,957 | $80,957 |
| 2015 | $2,404 | $159,482 | $79,741 | $79,741 |
| 2014 | $2,331 | $156,358 | $78,179 | $78,179 |
Property History
| Date | Event | Price | List to Sale | Price per Sq Ft |
|---|---|---|---|---|
| 11/12/2025 11/12/25 | Pending | -- | -- | -- |
| 10/28/2025 10/28/25 | For Sale | $515,000 | -- | $636 / Sq Ft |
Purchase History
| Date | Type | Sale Price | Title Company |
|---|---|---|---|
| Grant Deed | -- | None Listed On Document | |
| Grant Deed | $153,000 | Chicago Title Company | |
| Grant Deed | $335,000 | Old Republic Title Company | |
| Grant Deed | $125,000 | Fidelity National Title Co |
Mortgage History
| Date | Status | Loan Amount | Loan Type |
|---|---|---|---|
| Previous Owner | $100,000 | No Value Available |
Source: MLSListings
MLS Number: ML82026073
APN: 694-21-057
Disclaimer: Certain information contained herein is derived from information provided by parties other than Homes.com. All information provided is deemed reliable, but is not guaranteed to be accurate and should be independently verified.
![]() Property Information © 2025 MLSListings Inc. All rights reserved. Listing information is deemed reliable but not guaranteed. Certain information contained herein is derived from information which is the licensed property of, and copyrighted by, MLSListings Inc. The viewer acknowledges ownership and validity of its copyright. Information provided is for personal, non-commercial use by a viewer with a bona fide interest in the purchase or sale of real estate of the type being offered via this website or other electronic means. The viewer is prohibited from copying, redistributing or retransmitting any of the data or information provided by MLSListing, Inc.
Property Information © 2025 MLSListings Inc. All rights reserved. Listing information is deemed reliable but not guaranteed. Certain information contained herein is derived from information which is the licensed property of, and copyrighted by, MLSListings Inc. The viewer acknowledges ownership and validity of its copyright. Information provided is for personal, non-commercial use by a viewer with a bona fide interest in the purchase or sale of real estate of the type being offered via this website or other electronic means. The viewer is prohibited from copying, redistributing or retransmitting any of the data or information provided by MLSListing, Inc.
- 5630 Allen Ave Unit 4
- 5629 Playa Del Rey Ct Unit 3
- 5707 Calmor Ave Unit 3
- 5660 Calmor Ave Unit 4
- 734 Pronto Dr
- 5749 San Lorenzo Dr
- 5629 Morton Way
- 5870 Cabral Ave
- 5571 Sunny Oaks Dr
- 845 Villa Teresa Way Unit 845
- 882 Tallman Ct
- 827 Villa Teresa Way Unit 827
- 896 Villa Teresa Way
- 5949 Taormino Ave
- 5510 Dunsburry Way
- 5894 El Zuparko Dr Unit 2
- 5697 Chesbro Ave
- 5981 Lake Hennessy Ct
- 5850 Chesbro Ave
- 5986 Loma Prieta Dr