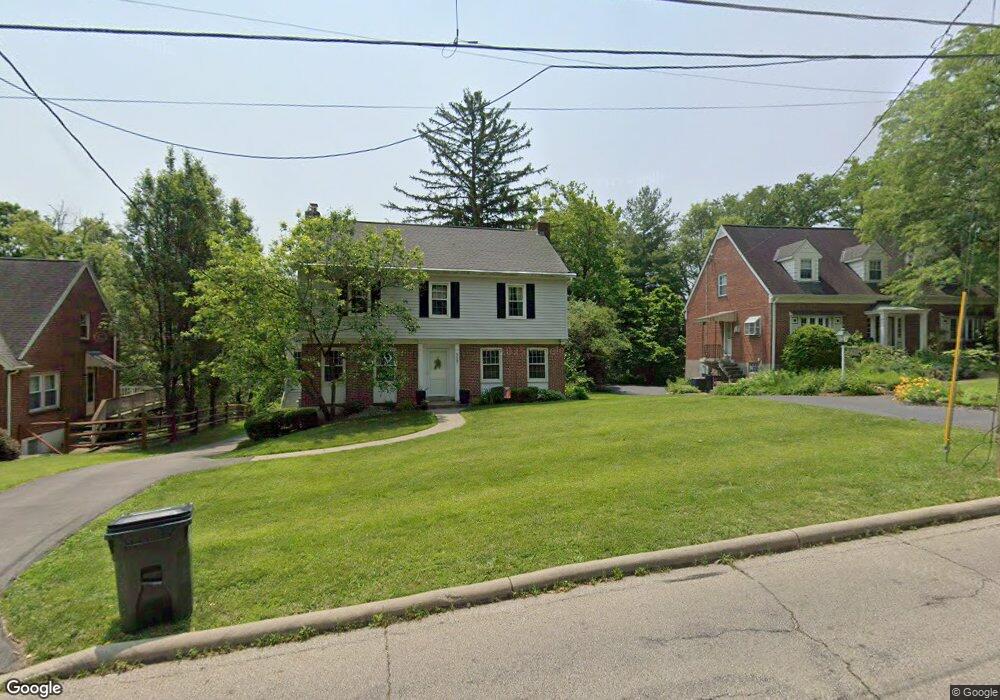
5687 Euclid Rd Cincinnati, OH 45236
Estimated Value: $345,000 - $423,000
3
Beds
2
Baths
2,434
Sq Ft
$159/Sq Ft
Est. Value
About This Home
This home is located at 5687 Euclid Rd, Cincinnati, OH 45236 and is currently estimated at $385,814, approximately $158 per square foot. 5687 Euclid Rd is a home located in Hamilton County with nearby schools including Silverton Paideia Elementary School, Shroder High School, and Clark Montessori High School.
Ownership History
Date
Name
Owned For
Owner Type
Purchase Details
Closed on
Feb 21, 2009
Sold by
Jadeed Katheryn E
Bought by
Jadeed Nabeel M
Current Estimated Value
Home Financials for this Owner
Home Financials are based on the most recent Mortgage that was taken out on this home.
Original Mortgage
$183,200
Outstanding Balance
$112,592
Interest Rate
4.91%
Mortgage Type
New Conventional
Estimated Equity
$273,222
Purchase Details
Closed on
Nov 29, 2001
Sold by
Kilfoil Sheila A
Bought by
Jadeed Nabeel M and Jadeed Katheryn E
Home Financials for this Owner
Home Financials are based on the most recent Mortgage that was taken out on this home.
Original Mortgage
$127,200
Interest Rate
6.49%
Create a Home Valuation Report for This Property
The Home Valuation Report is an in-depth analysis detailing your home's value as well as a comparison with similar homes in the area
Home Values in the Area
Average Home Value in this Area
Purchase History
| Date | Buyer | Sale Price | Title Company |
|---|---|---|---|
| Jadeed Nabeel M | -- | Prodigy Title Agency Llc | |
| Jadeed Nabeel M | $159,000 | C & R Title Agency Inc |
Source: Public Records
Mortgage History
| Date | Status | Borrower | Loan Amount |
|---|---|---|---|
| Open | Jadeed Nabeel M | $183,200 | |
| Closed | Jadeed Nabeel M | $127,200 | |
| Closed | Jadeed Nabeel M | $31,800 |
Source: Public Records
Tax History
| Year | Tax Paid | Tax Assessment Tax Assessment Total Assessment is a certain percentage of the fair market value that is determined by local assessors to be the total taxable value of land and additions on the property. | Land | Improvement |
|---|---|---|---|---|
| 2025 | $6,234 | $98,242 | $17,808 | $80,434 |
| 2024 | $6,062 | $98,242 | $17,808 | $80,434 |
| 2023 | $6,186 | $98,242 | $17,808 | $80,434 |
| 2022 | $5,120 | $67,711 | $13,517 | $54,194 |
| 2021 | $4,998 | $67,711 | $13,517 | $54,194 |
| 2020 | $5,104 | $67,711 | $13,517 | $54,194 |
| 2019 | $5,404 | $63,879 | $12,751 | $51,128 |
| 2018 | $5,410 | $62,164 | $12,751 | $49,413 |
| 2017 | $5,051 | $62,164 | $12,751 | $49,413 |
| 2016 | $5,113 | $63,763 | $12,264 | $51,499 |
| 2015 | $4,666 | $63,763 | $12,264 | $51,499 |
| 2014 | $4,559 | $63,763 | $12,264 | $51,499 |
| 2013 | $4,576 | $63,130 | $12,142 | $50,988 |
Source: Public Records
Map
Nearby Homes
- 5635 Euclid Rd
- 4248 South Ave
- 4155 Home St
- 6705 Elwynne Dr
- 7034 East Ave
- 7633 Montgomery Rd
- 7633 Montgomery Rd Unit 3
- 6656 Plainfield Rd
- 6829 Alpine Ave
- 7752 Montgomery Rd
- 4025 Deer Park Ave
- 4300 Hegner Ave
- 3964 Zinsle Ave
- 4106 Orchard Ln
- 3906 Standish Ave
- 6495 Dawson Rd
- 3962 S Fordham Place
- 3990 Superior Ave
- 6221 Hedge Ave
- 4050 O'Leary Ave
- 5673 Euclid Rd
- 5721 Euclid Rd
- 5661 Euclid Rd
- 6785 Ken Arbre Dr
- 6771 Ken Arbre Dr
- 5698 Euclid Ave
- 5647 Euclid Rd
- 5739 Euclid Rd
- 6761 Ken Arbre Dr
- 5694 Euclid Rd
- 5660 Euclid Rd
- 5678 Euclid Rd
- 6761 Ken Arbre Dr
- 5698 Euclid Rd
- 6835 Ken Arbre Dr
- 5730 Euclid Rd
- 6753 Ken Arbre Dr
- 5761 Euclid Rd
- 5748 Euclid Rd
- 6839 Ken Arbre Dr
Your Personal Tour Guide
Ask me questions while you tour the home.