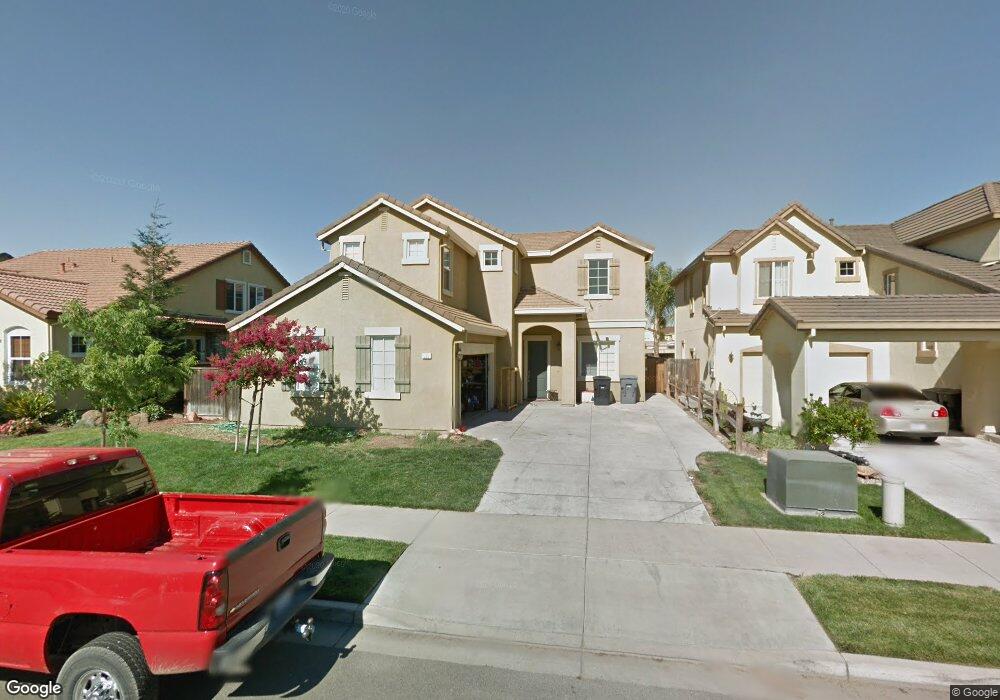
569 Branding Iron St Oakdale, CA 95361
Estimated Value: $605,000 - $636,000
4
Beds
3
Baths
2,841
Sq Ft
$219/Sq Ft
Est. Value
About This Home
This home is located at 569 Branding Iron St, Oakdale, CA 95361 and is currently estimated at $622,816, approximately $219 per square foot. 569 Branding Iron St is a home located in Stanislaus County with nearby schools including Fair Oaks Elementary School, Oakdale Junior High School, and East Stanislaus High School.
Ownership History
Date
Name
Owned For
Owner Type
Purchase Details
Closed on
Jul 10, 2017
Sold by
Shanks Lorraine
Bought by
Shanks Lorraine and Shanks 2004 Family Trust
Current Estimated Value
Home Financials for this Owner
Home Financials are based on the most recent Mortgage that was taken out on this home.
Original Mortgage
$309,500
Outstanding Balance
$257,142
Interest Rate
3.89%
Mortgage Type
New Conventional
Estimated Equity
$365,674
Purchase Details
Closed on
Sep 26, 2016
Sold by
Shanks Lorraine
Bought by
Shanks Lorraine
Home Financials for this Owner
Home Financials are based on the most recent Mortgage that was taken out on this home.
Original Mortgage
$308,000
Interest Rate
3.43%
Mortgage Type
New Conventional
Purchase Details
Closed on
Aug 30, 2016
Sold by
Shanks Lorraine
Bought by
Shanks Lorraine and Shanks 2004 Family Trust
Home Financials for this Owner
Home Financials are based on the most recent Mortgage that was taken out on this home.
Original Mortgage
$308,000
Interest Rate
3.43%
Mortgage Type
New Conventional
Purchase Details
Closed on
Aug 31, 2015
Sold by
Shanks Lorraine
Bought by
Shanks Lorraine and Shanks 2004 Family Trust
Purchase Details
Closed on
May 30, 2014
Sold by
Schulke Shane H
Bought by
Shanks Lorraine
Home Financials for this Owner
Home Financials are based on the most recent Mortgage that was taken out on this home.
Original Mortgage
$249,600
Interest Rate
4.25%
Mortgage Type
New Conventional
Purchase Details
Closed on
Mar 4, 2009
Sold by
Hsbc Bank Usa National Association
Bought by
Schulke Shane H
Home Financials for this Owner
Home Financials are based on the most recent Mortgage that was taken out on this home.
Original Mortgage
$235,887
Interest Rate
5.03%
Mortgage Type
FHA
Purchase Details
Closed on
Mar 2, 2009
Sold by
Schulke Brynna K
Bought by
Schulke Shane H
Home Financials for this Owner
Home Financials are based on the most recent Mortgage that was taken out on this home.
Original Mortgage
$235,887
Interest Rate
5.03%
Mortgage Type
FHA
Purchase Details
Closed on
Sep 4, 2008
Sold by
Ramirez Elia
Bought by
Hsbc Bank Usa Na and Deutsche Alt A Securities Mortgage Loan
Purchase Details
Closed on
Dec 2, 2005
Sold by
Bridle Ridge I Llc
Bought by
Ramirez Angel and Ramirez Elia
Home Financials for this Owner
Home Financials are based on the most recent Mortgage that was taken out on this home.
Original Mortgage
$354,400
Interest Rate
7%
Mortgage Type
Purchase Money Mortgage
Create a Home Valuation Report for This Property
The Home Valuation Report is an in-depth analysis detailing your home's value as well as a comparison with similar homes in the area
Home Values in the Area
Average Home Value in this Area
Purchase History
| Date | Buyer | Sale Price | Title Company |
|---|---|---|---|
| Shanks Lorraine | -- | Commonwealth Land Title Co | |
| Shanks Lorraine | -- | Commonwealth Land Title Co | |
| Shanks Lorraine | -- | First American Title | |
| Shanks Lorraine | -- | First American Title Company | |
| Shanks Lorraine | -- | None Available | |
| Shanks Lorraine | $312,000 | First American Title Company | |
| Schulke Shane H | $239,000 | North American Title Co | |
| Schulke Shane H | -- | North American Title Company | |
| Hsbc Bank Usa Na | $175,500 | Accommodation | |
| Ramirez Angel | $443,000 | Chicago Title Co |
Source: Public Records
Mortgage History
| Date | Status | Borrower | Loan Amount |
|---|---|---|---|
| Open | Shanks Lorraine | $309,500 | |
| Closed | Shanks Lorraine | $308,000 | |
| Closed | Shanks Lorraine | $249,600 | |
| Previous Owner | Schulke Shane H | $235,887 | |
| Previous Owner | Schulke Shane H | $235,887 | |
| Previous Owner | Ramirez Angel | $354,400 |
Source: Public Records
Tax History Compared to Growth
Tax History
| Year | Tax Paid | Tax Assessment Tax Assessment Total Assessment is a certain percentage of the fair market value that is determined by local assessors to be the total taxable value of land and additions on the property. | Land | Improvement |
|---|---|---|---|---|
| 2025 | $6,024 | $399,866 | $122,581 | $277,285 |
| 2024 | $5,774 | $392,027 | $120,178 | $271,849 |
| 2023 | $5,651 | $384,341 | $117,822 | $266,519 |
| 2022 | $5,535 | $376,806 | $115,512 | $261,294 |
| 2021 | $5,433 | $369,419 | $113,248 | $256,171 |
| 2020 | $5,378 | $365,632 | $112,087 | $253,545 |
| 2019 | $5,289 | $358,464 | $109,890 | $248,574 |
| 2018 | $5,210 | $351,436 | $107,736 | $243,700 |
| 2017 | $4,977 | $329,546 | $105,624 | $223,922 |
| 2016 | $4,901 | $323,085 | $103,553 | $219,532 |
| 2015 | $4,897 | $318,233 | $101,998 | $216,235 |
| 2014 | $4,154 | $251,065 | $63,028 | $188,037 |
Source: Public Records
Map
Nearby Homes
- 562 Ranger St
- 968 Greger St Unit 91
- 557 Stetson Dr
- 980 Silver Spur Cir Unit 41
- 429 Ranger Ct Unit 111
- 596 Hudson Ave
- 1039 Longview Dr
- 1030 Meadowlands Dr Unit MODEL
- Sequoia Plan at The Meadowlands
- Willow Plan at The Meadowlands
- Alder Plan at The Meadowlands
- Ponderosa Plan at The Meadowlands
- Redwood Plan at The Meadowlands
- 886 Ranchland Way
- 901 Meadowlands Dr
- 1601 W J St
- 1105 W G St
- 1759 Churchill Downs Cir
- 1766 Churchill Downs Cir
- 1863 Vintage Cir
- 561 Branding Iron St
- 577 Branding Iron St
- 564 Dales Pony Dr
- 556 Dales Pony Dr
- 585 Branding Iron St
- 553 Branding Iron St
- 572 Dale's Pony Dr
- 572 Dales Pony Dr
- 574 Branding Iron St
- 566 Branding Iron St
- 509 Ranger St
- 593 Branding Iron St
- 582 Branding Iron St
- 580 Dales Pony Dr
- 515 Ranger St
- 1228 Greger St
- 521 Ranger St
- 498 Ranger St
- 561 Dales Pony Dr
- 492 Ranger St