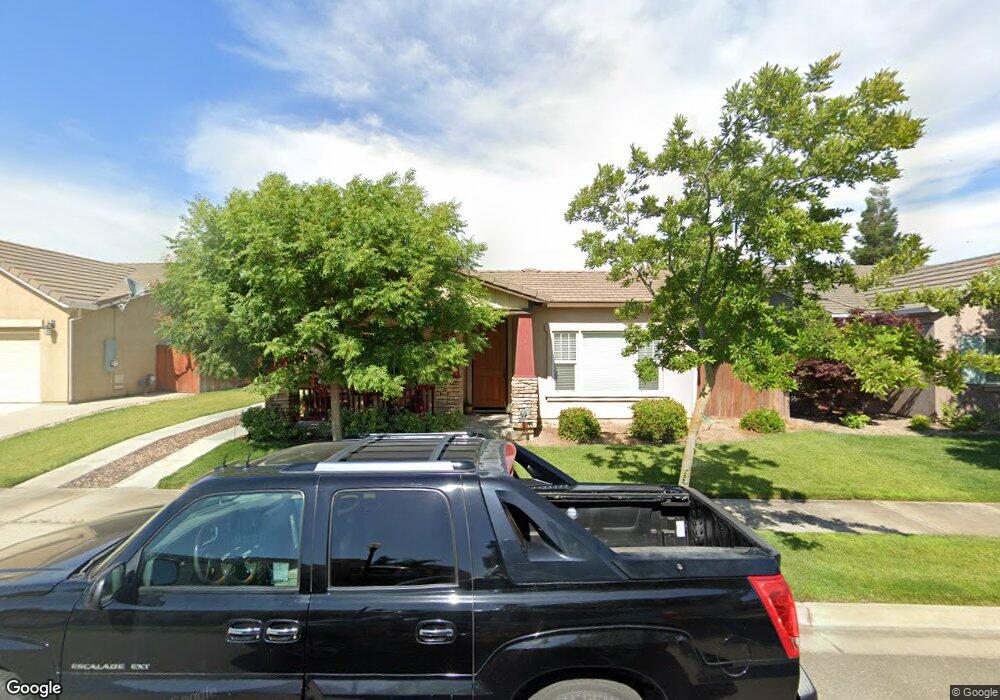
569 Dales Pony Dr Oakdale, CA 95361
Estimated Value: $510,519 - $582,000
3
Beds
2
Baths
1,740
Sq Ft
$316/Sq Ft
Est. Value
About This Home
This home is located at 569 Dales Pony Dr, Oakdale, CA 95361 and is currently estimated at $549,130, approximately $315 per square foot. 569 Dales Pony Dr is a home with nearby schools including Fair Oaks Elementary School, Oakdale Junior High School, and East Stanislaus High School.
Ownership History
Date
Name
Owned For
Owner Type
Purchase Details
Closed on
Feb 4, 2025
Sold by
Cunningham Steven A and Cunningham Kathleen A
Bought by
Steven And Kathleen Cunningham Family Trust and Cunningham
Current Estimated Value
Purchase Details
Closed on
Jul 2, 2013
Sold by
Rh Oakdale Lp
Bought by
Cunningham Steven A and Cunningham Kathleen A
Home Financials for this Owner
Home Financials are based on the most recent Mortgage that was taken out on this home.
Original Mortgage
$257,135
Interest Rate
3.57%
Mortgage Type
VA
Purchase Details
Closed on
Jan 17, 2007
Sold by
Hearthstone Multi Asset Entity A Lp
Bought by
Wl Homes Llc
Home Financials for this Owner
Home Financials are based on the most recent Mortgage that was taken out on this home.
Original Mortgage
$250,000
Interest Rate
6.1%
Mortgage Type
Construction
Create a Home Valuation Report for This Property
The Home Valuation Report is an in-depth analysis detailing your home's value as well as a comparison with similar homes in the area
Home Values in the Area
Average Home Value in this Area
Purchase History
| Date | Buyer | Sale Price | Title Company |
|---|---|---|---|
| Steven And Kathleen Cunningham Family Trust | -- | None Listed On Document | |
| Cunningham Steven A | $252,000 | Placer Title Company | |
| Wl Homes Llc | -- | None Available |
Source: Public Records
Mortgage History
| Date | Status | Borrower | Loan Amount |
|---|---|---|---|
| Previous Owner | Cunningham Steven A | $257,135 | |
| Previous Owner | Wl Homes Llc | $250,000 |
Source: Public Records
Tax History Compared to Growth
Tax History
| Year | Tax Paid | Tax Assessment Tax Assessment Total Assessment is a certain percentage of the fair market value that is determined by local assessors to be the total taxable value of land and additions on the property. | Land | Improvement |
|---|---|---|---|---|
| 2025 | $5,050 | $308,566 | $61,288 | $247,278 |
| 2024 | $4,922 | $302,517 | $60,087 | $242,430 |
| 2023 | $4,840 | $296,586 | $58,909 | $237,677 |
| 2022 | $4,733 | $290,771 | $57,754 | $233,017 |
| 2021 | $4,658 | $285,071 | $56,622 | $228,449 |
| 2020 | $4,596 | $282,149 | $56,042 | $226,107 |
| 2019 | $4,541 | $276,618 | $54,944 | $221,674 |
| 2018 | $4,458 | $271,195 | $53,867 | $217,328 |
| 2017 | $4,366 | $265,878 | $52,811 | $213,067 |
| 2016 | $4,304 | $260,666 | $51,776 | $208,890 |
| 2015 | $4,285 | $256,752 | $50,999 | $205,753 |
| 2014 | $4,254 | $251,723 | $50,000 | $201,723 |
Source: Public Records
Map
Nearby Homes
- 968 Greger St Unit 91
- 980 Silver Spur Cir Unit 41
- 562 Ranger St
- 557 Stetson Dr
- 429 Ranger Ct Unit 111
- 886 Ranchland Way
- 1039 Longview Dr
- 1030 Meadowlands Dr Unit MODEL
- Sequoia Plan at The Meadowlands
- Willow Plan at The Meadowlands
- Alder Plan at The Meadowlands
- Ponderosa Plan at The Meadowlands
- Redwood Plan at The Meadowlands
- 901 Meadowlands Dr
- 596 Hudson Ave
- 1105 W G St
- 1601 W J St
- 1759 Churchill Downs Cir
- 1766 Churchill Downs Cir
- 24 N Bryan Ave
- 561 Dales Pony Dr
- 577 Dale's Pony Dr
- 572 Clydesdale Dr
- 564 Clydesdale Dr
- 553 Dales Pony Dr
- 580 Clydesdale Dr
- 585 Dales Pony Dr
- 572 Dale's Pony Dr
- 558 Clydesdale Dr
- 564 Dales Pony Dr
- 572 Dales Pony Dr
- 588 Clydesdale Dr
- 545 Dales Pony Dr
- 10318 Clydesdale Dr
- 556 Dales Pony Dr
- 580 Dales Pony Dr
- 550 Clydesdale Dr
- 577 Branding Iron St
- 585 Branding Iron St
- 569 Branding Iron St