569 Flora Dr Algonquin, IL 60102
High Hill Farms NeighborhoodEstimated Value: $382,605 - $488,000
About This Home
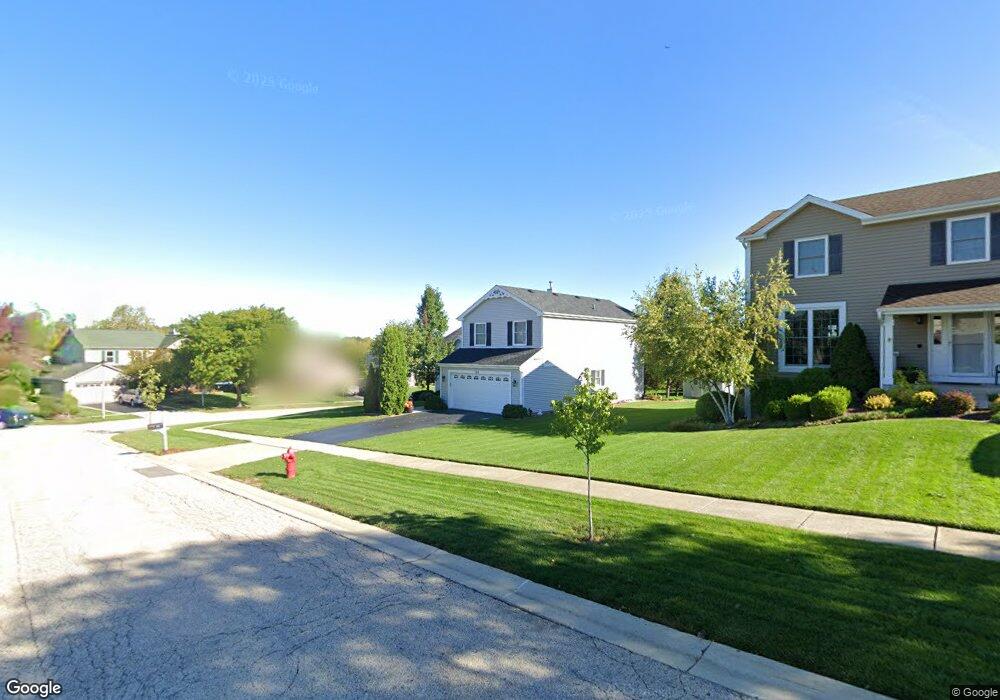
This home is located at 569 Flora Dr, Algonquin, IL 60102 and is currently estimated at $423,151, approximately $304 per square foot. 569 Flora Dr is a home located in McHenry County with nearby schools including Westfield Community School, Kenneth E Neubert Elementary School, and Harry D Jacobs High School.
Ownership History
We collect this data history from publicly available records. To have your information removed, we recommend requesting removal directly through your county’s website.
Purchase Details
Purchase Details
Home Financials for this Owner
Home Financials are based on the most recent Mortgage that was taken out on this home.Purchase Details
Purchase Details
Home Financials for this Owner
Home Financials are based on the most recent Mortgage that was taken out on this home.Home Values in the Area
Average Home Value in this Area
Purchase History
We collect this data history from publicly available records. To have your information removed, we recommend requesting removal directly through your county’s website.
| Date | Buyer | Sale Price | Title Company |
|---|---|---|---|
| -- | None Listed On Document | ||
| -- | First Amer Title | ||
| $174,500 | Universal Title Services Inc | ||
| $171,000 | Chicago Title Insurance Co |
Mortgage History
We collect this data history from publicly available records. To have your information removed, we recommend requesting removal directly through your county’s website.
| Date | Status | Borrower | Loan Amount |
|---|---|---|---|
| Previous Owner | $994,000 | ||
| Previous Owner | $125,000 |
Tax History
We collect this data history from publicly available records. To have your information removed, we recommend requesting removal directly through your county’s website.
| Year | Tax Paid | Tax Assessment Tax Assessment Total Assessment is a certain percentage of the fair market value that is determined by local assessors to be the total taxable value of land and additions on the property. | Land | Improvement |
|---|---|---|---|---|
| 2024 | $3,539 | $117,906 | $24,330 | $93,576 |
| 2023 | $3,787 | $105,452 | $21,760 | $83,692 |
| 2022 | $4,309 | $94,091 | $21,044 | $73,047 |
| 2021 | $4,458 | $87,657 | $19,605 | $68,052 |
| 2020 | $4,511 | $84,554 | $18,911 | $65,643 |
| 2019 | $4,613 | $80,928 | $18,100 | $62,828 |
| 2018 | $4,789 | $74,761 | $16,721 | $58,040 |
| 2017 | $5,003 | $70,429 | $15,752 | $54,677 |
| 2016 | $5,283 | $66,056 | $14,774 | $51,282 |
| 2013 | -- | $63,939 | $13,783 | $50,156 |
Map
- 731 Roaring Brook Ln
- 811 Westbury Dr
- 425 Somerset Ct
- 295 Winchester Dr
- 1610 Hartley Dr
- 1600 Huntington Dr N
- 275 Farmhill Dr
- 761 Majestic Dr
- 750 Majestic Dr
- 1431 Essex St
- 190 Lake Dr S
- 1141 Stonegate Rd
- 1 Grandview Ct
- 1141 Millcreek Ln
- 155 Salford Dr
- 1713 Edgewood Dr
- 635 Oakview Dr Unit 6
- 1148 Sawmill Ln
- 1111 Saint Andrews Ct Unit 282
- 1210 Merrill Ave
Ask me questions while you tour the home.