569 Wilbur Ave Cranston, RI 02921
Western Cranston NeighborhoodEstimated Value: $503,000 - $608,000
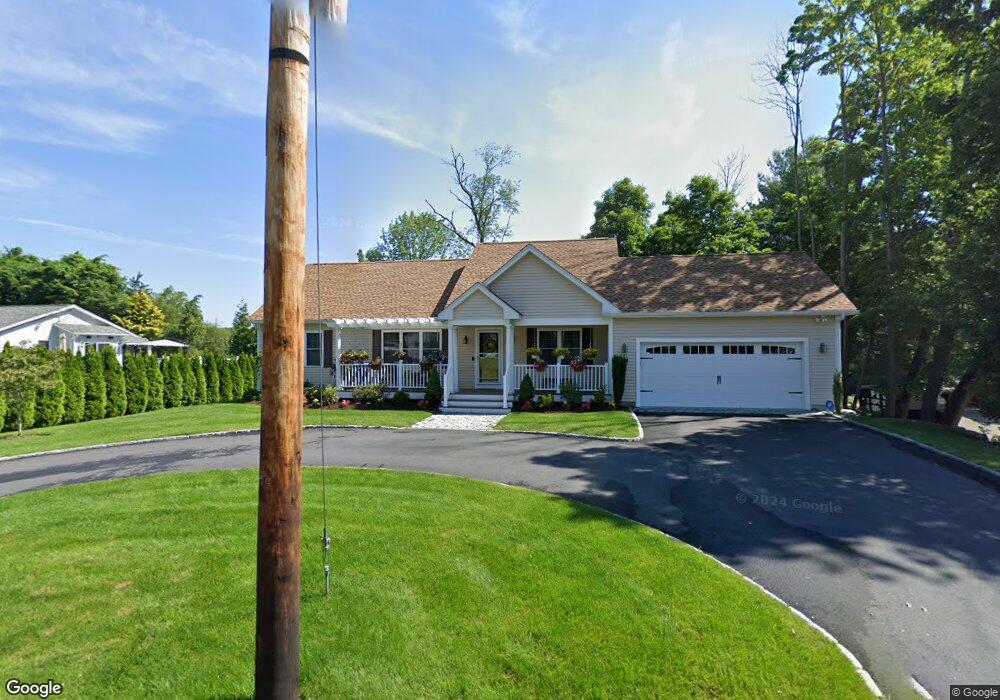
About This Home
This home is located at 569 Wilbur Ave, Cranston, RI 02921 and is currently estimated at $555,964, approximately $451 per square foot. 569 Wilbur Ave is a home with nearby schools including Orchard Farms El. School, Hope Highlands Middle School, and Cranston High School West.
Ownership History
We collect this data history from publicly available records. To have your information removed, we recommend requesting removal directly through your county’s website.
Purchase Details
Purchase Details
Purchase Details
Home Financials for this Owner
Home Financials are based on the most recent Mortgage that was taken out on this home.Purchase Details
Home Values in the Area
Average Home Value in this Area
Purchase History
We collect this data history from publicly available records. To have your information removed, we recommend requesting removal directly through your county’s website.
| Date | Buyer | Sale Price | Title Company |
|---|---|---|---|
| -- | None Available | ||
| $375,000 | -- | ||
| $75,000 | -- | ||
| -- | -- |
Mortgage History
We collect this data history from publicly available records. To have your information removed, we recommend requesting removal directly through your county’s website.
| Date | Status | Borrower | Loan Amount |
|---|---|---|---|
| Previous Owner | $15,000 |
Tax History
We collect this data history from publicly available records. To have your information removed, we recommend requesting removal directly through your county’s website.
| Year | Tax Paid | Tax Assessment Tax Assessment Total Assessment is a certain percentage of the fair market value that is determined by local assessors to be the total taxable value of land and additions on the property. | Land | Improvement |
|---|---|---|---|---|
| 2025 | $6,109 | $440,100 | $117,500 | $322,600 |
| 2024 | $5,990 | $440,100 | $117,500 | $322,600 |
| 2023 | $5,899 | $312,100 | $81,500 | $230,600 |
| 2022 | $5,777 | $312,100 | $81,500 | $230,600 |
| 2021 | $5,618 | $312,100 | $81,500 | $230,600 |
| 2020 | $6,941 | $334,200 | $77,600 | $256,600 |
| 2019 | $6,941 | $334,200 | $77,600 | $256,600 |
| 2018 | $6,781 | $334,200 | $77,600 | $256,600 |
| 2017 | $6,737 | $293,700 | $69,800 | $223,900 |
| 2016 | $6,594 | $293,700 | $69,800 | $223,900 |
| 2015 | $6,594 | $293,700 | $69,800 | $223,900 |
| 2014 | $1,535 | $67,200 | $67,200 | $0 |
Map
- 14 Blueberry Ln
- 56 Sweet Fern Dr
- 24 Sweet Fern Dr
- 123 Hines Farm Rd
- 1100 Phenix Ave
- 14 Canton Ct
- 38 Angela Ave
- 50 Brookdale Ave
- 61 Cardinal Rd
- 14 Cardinal Rd
- 74 Cardinal Rd
- 2 Dogwood Dr
- 8 Ashton Ct
- 87 Lincoln Park Ave
- 50 Searle Ave
- 25 Stoneham St
- 5 Collingwood Dr
- 7 Esther St
- 136 Hope Hill Terrace
- 311 Hope Rd
Ask me questions while you tour the home.