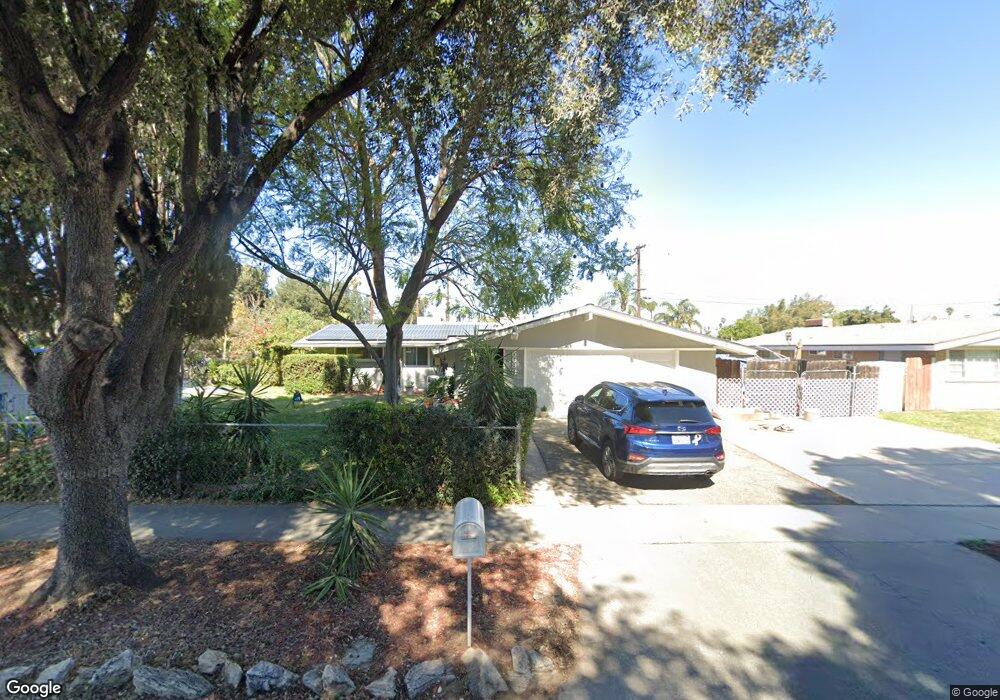
5693 Portola Way Riverside, CA 92504
Estimated Value: $581,000 - $625,000
3
Beds
2
Baths
1,382
Sq Ft
$432/Sq Ft
Est. Value
About This Home
This home is located at 5693 Portola Way, Riverside, CA 92504 and is currently estimated at $596,927, approximately $431 per square foot. 5693 Portola Way is a home located in Riverside County with nearby schools including Jefferson Elementary School, Sierra Middle School, and Ramona High School.
Ownership History
Date
Name
Owned For
Owner Type
Purchase Details
Closed on
Jan 21, 2021
Sold by
Hopkins Bruce C
Bought by
Hopkins Bruce C and Hopkins Deborah A
Current Estimated Value
Home Financials for this Owner
Home Financials are based on the most recent Mortgage that was taken out on this home.
Original Mortgage
$687,000
Interest Rate
2.7%
Mortgage Type
Reverse Mortgage Home Equity Conversion Mortgage
Purchase Details
Closed on
Mar 27, 2017
Sold by
Hopkins Deborah
Bought by
Hopkins Bruce C and Hopkins Deborah
Purchase Details
Closed on
Mar 24, 2017
Sold by
Hopkins Deborah
Bought by
Hopkins Bruce C
Purchase Details
Closed on
Oct 1, 2007
Sold by
Eaton Larry S
Bought by
Hopkins Deborah
Purchase Details
Closed on
Mar 23, 2003
Sold by
Eaton Larry S and Eaton Larry
Bought by
Eaton Larry S
Create a Home Valuation Report for This Property
The Home Valuation Report is an in-depth analysis detailing your home's value as well as a comparison with similar homes in the area
Home Values in the Area
Average Home Value in this Area
Purchase History
| Date | Buyer | Sale Price | Title Company |
|---|---|---|---|
| Hopkins Bruce C | -- | Placer Title Company | |
| Hopkins Bruce C | -- | Accommodation | |
| Hopkins Bruce C | -- | Corinthian Title Company | |
| Hopkins Deborah | -- | None Available | |
| Eaton Larry S | -- | -- |
Source: Public Records
Mortgage History
| Date | Status | Borrower | Loan Amount |
|---|---|---|---|
| Closed | Hopkins Bruce C | $687,000 |
Source: Public Records
Tax History Compared to Growth
Tax History
| Year | Tax Paid | Tax Assessment Tax Assessment Total Assessment is a certain percentage of the fair market value that is determined by local assessors to be the total taxable value of land and additions on the property. | Land | Improvement |
|---|---|---|---|---|
| 2025 | $1,347 | $126,513 | $22,176 | $104,337 |
| 2023 | $1,347 | $121,603 | $21,316 | $100,287 |
| 2022 | $1,314 | $119,220 | $20,899 | $98,321 |
| 2021 | $1,310 | $116,884 | $20,490 | $96,394 |
| 2020 | $1,300 | $115,686 | $20,280 | $95,406 |
| 2019 | $1,275 | $113,419 | $19,883 | $93,536 |
| 2018 | $2,870 | $111,196 | $19,494 | $91,702 |
| 2017 | $1,227 | $109,016 | $19,112 | $89,904 |
| 2016 | $2,643 | $106,880 | $18,738 | $88,142 |
| 2015 | $2,635 | $105,276 | $18,457 | $86,819 |
| 2014 | $2,622 | $103,216 | $18,097 | $85,119 |
Source: Public Records
Map
Nearby Homes
- 6712 La Jolla Dr
- 6746 La Jolla Dr
- 5801 Walter St
- 6757 Clifford St
- 6863 La Jolla Dr
- 5455 Wayman St
- 6848 Holbrook Way
- 6250 Hillside Ave
- 6656 Cathy Place
- 5332 Walter St
- 5952 Maybelle St
- 6985 Malibu Dr
- 5945 Crystal Hill St
- 6140 Antioch Ave
- 5796 Mountain View Ave
- 5898 Mountain View Ave
- 6164 Goldenrod Ln
- 8204 Verbena Dr
- 6025 Florence St
- 6473 Capistrano Way
- 5683 Portola Way
- 5694 Central Ave
- 5684 Central Ave
- 6661 La Jolla Dr
- 5671 Portola Way
- 5672 Central Ave
- 6669 La Jolla Dr
- 5661 Portola Way
- 6662 La Jolla Dr
- 5662 Central Ave
- 5691 Central Ave
- 6670 La Jolla Dr
- 6679 La Jolla Dr Unit A
- 6679 La Jolla Dr
- 5647 Portola Way
- 5681 Central Ave
- 5650 Central Ave
- 6681 La Jolla Dr
- 6589 Hillside Ave
- 6661 El Cajon Dr