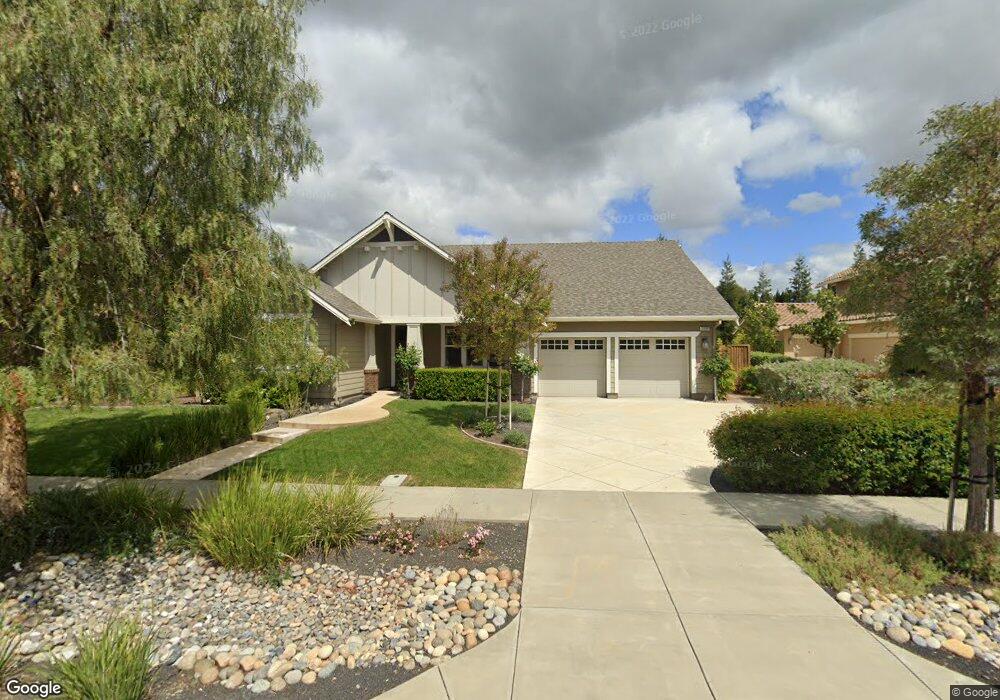
5698 Stockton Loop Livermore, CA 94550
Estimated Value: $1,777,000 - $2,053,000
4
Beds
3
Baths
2,565
Sq Ft
$746/Sq Ft
Est. Value
About This Home
This home is located at 5698 Stockton Loop, Livermore, CA 94550 and is currently estimated at $1,914,220, approximately $746 per square foot. 5698 Stockton Loop is a home located in Alameda County with nearby schools including Arroyo Seco Elementary School, East Avenue Middle School, and Livermore High School.
Ownership History
Date
Name
Owned For
Owner Type
Purchase Details
Closed on
Feb 6, 2024
Sold by
Yuen Edwin Ngai-Sang and Yuen Kathryn Kuen
Bought by
Edwin N S Yuen And Kathryn Kuen Lee Trust and Yuen
Current Estimated Value
Purchase Details
Closed on
Mar 24, 2016
Sold by
Chin Daniel W and Chin Mona R
Bought by
Yuen Edwin Ngai Sang and Lee Kathryn Kuen
Home Financials for this Owner
Home Financials are based on the most recent Mortgage that was taken out on this home.
Original Mortgage
$417,000
Interest Rate
3.5%
Mortgage Type
Adjustable Rate Mortgage/ARM
Purchase Details
Closed on
Aug 7, 2012
Sold by
South Livermore Development Company
Bought by
Chin Daniel W and Chin Mona R
Create a Home Valuation Report for This Property
The Home Valuation Report is an in-depth analysis detailing your home's value as well as a comparison with similar homes in the area
Purchase History
| Date | Buyer | Sale Price | Title Company |
|---|---|---|---|
| Edwin N S Yuen And Kathryn Kuen Lee Trust | -- | None Listed On Document | |
| Yuen Edwin Ngai Sang | $1,230,000 | Old Republic Title Company | |
| Chin Daniel W | $832,000 | Chicago Title Company |
Source: Public Records
Mortgage History
| Date | Status | Borrower | Loan Amount |
|---|---|---|---|
| Previous Owner | Yuen Edwin Ngai Sang | $417,000 |
Source: Public Records
Tax History
| Year | Tax Paid | Tax Assessment Tax Assessment Total Assessment is a certain percentage of the fair market value that is determined by local assessors to be the total taxable value of land and additions on the property. | Land | Improvement |
|---|---|---|---|---|
| 2025 | $18,644 | $1,502,459 | $436,811 | $1,065,648 |
| 2024 | $18,644 | $1,473,000 | $428,246 | $1,044,754 |
| 2023 | $18,387 | $1,444,125 | $419,851 | $1,024,274 |
| 2022 | $18,122 | $1,415,809 | $411,619 | $1,004,190 |
| 2021 | $17,052 | $1,388,052 | $403,549 | $984,503 |
| 2020 | $17,286 | $1,373,823 | $399,412 | $974,411 |
| 2019 | $17,465 | $1,346,891 | $391,582 | $955,309 |
| 2018 | $17,078 | $1,320,491 | $383,907 | $936,584 |
| 2017 | $16,584 | $1,294,600 | $376,380 | $918,220 |
| 2016 | $11,375 | $870,568 | $259,537 | $611,031 |
| 2015 | $10,702 | $857,495 | $255,640 | $601,855 |
| 2014 | $10,530 | $840,698 | $250,632 | $590,066 |
Source: Public Records
Map
Nearby Homes
- 5454 Stockton Loop
- 5590 Hopps Ln
- 5143 Tesla Rd
- 5218 Norma Way
- 4669 Almond Cir
- 1368 Pegan Common
- 5287 Diane Ln
- 2779 Silverado Ct
- 1762 Cheryl Dr
- 1411 Justine Ct
- 838 Hazel St
- 732 Hazel St
- 973 Jessica Dr
- 1147 Rebecca Dr
- 6741 Tesla Rd
- 4844 Mulqueeney Common
- 337 Chris Common Unit 111
- 4671 Laurie Common Unit 105
- 4671 Laurie Common Unit 103
- 3910 East Ave
- 5670 Stockton Loop
- 5716 Stockton Loop
- 5450 Stockton Loop
- 5662 Stockton Loop
- 5436 Stockton Loop
- 5744 Stockton Loop
- 2507 White Crane Cir
- 5701 Stockton Loop
- 5472 Stockton Loop
- 5733 Stockton Loop
- 2529 White Crane Cir
- 2795 Cooper Cir
- 5749 Stockton Loop
- 2542 White Crane Cir
- 5498 Stockton Loop
- 5469 Stockton Loop
- 5443 Stockton Loop
- 2551 White Crane Cir
- 2781 Cooper Cir
- 5421 Stockton Loop
Your Personal Tour Guide
Ask me questions while you tour the home.