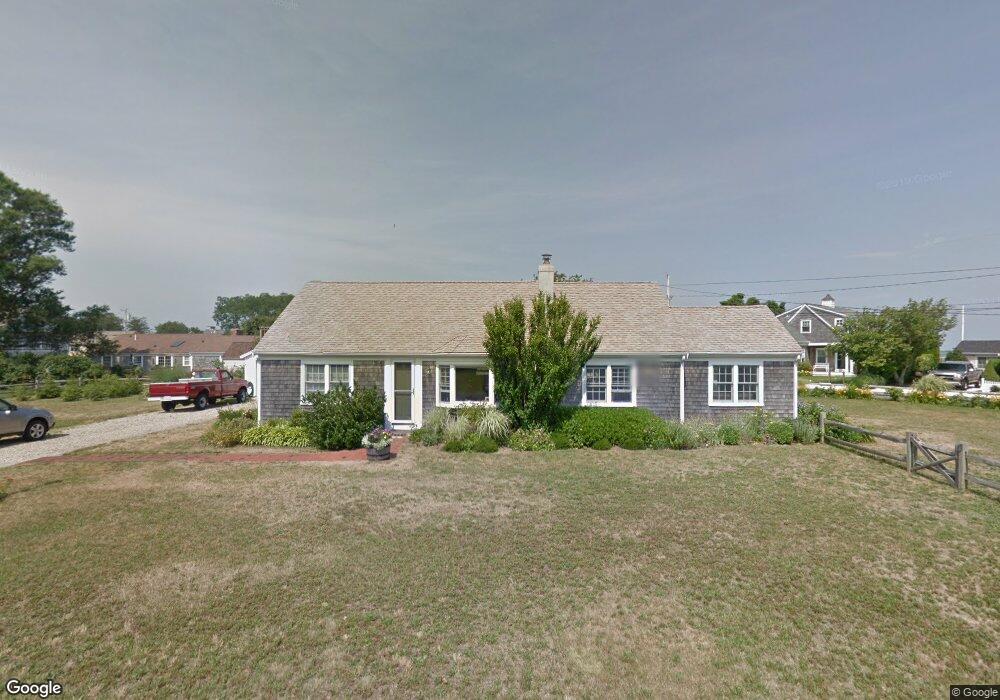
57 1st Way Barnstable, MA 02630
Barnstable Village NeighborhoodEstimated Value: $1,105,000 - $1,426,000
2
Beds
1
Bath
1,165
Sq Ft
$1,134/Sq Ft
Est. Value
About This Home
This home is located at 57 1st Way, Barnstable, MA 02630 and is currently estimated at $1,321,473, approximately $1,134 per square foot. 57 1st Way is a home located in Barnstable County with nearby schools including West Barnstable Elementary School, Barnstable United Elementary School, and Barnstable Intermediate School.
Ownership History
Date
Name
Owned For
Owner Type
Purchase Details
Closed on
May 14, 2024
Sold by
Betti Robert C and Betti Elizabeth
Bought by
Cape Cod Family Prop Llc
Current Estimated Value
Purchase Details
Closed on
Sep 28, 2020
Sold by
Cape Cod Family Prop Llc
Bought by
Betti Robert C and Betti Elizabeth
Purchase Details
Closed on
Jun 11, 2007
Sold by
Holman Rt and Mackerron
Bought by
Cape Cod Family Prope
Home Financials for this Owner
Home Financials are based on the most recent Mortgage that was taken out on this home.
Original Mortgage
$560,000
Interest Rate
6.17%
Mortgage Type
Purchase Money Mortgage
Create a Home Valuation Report for This Property
The Home Valuation Report is an in-depth analysis detailing your home's value as well as a comparison with similar homes in the area
Home Values in the Area
Average Home Value in this Area
Purchase History
We collect this data history from publicly available records. To have your information removed, we recommend requesting removal directly through your county’s website.
| Date | Buyer | Sale Price | Title Company |
|---|---|---|---|
| Cape Cod Family Prop Llc | -- | None Available | |
| Cape Cod Family Prop Llc | -- | None Available | |
| Betti Robert C | -- | None Available | |
| Betti Robert | -- | None Available | |
| Cape Cod Family Prope | $700,000 | -- | |
| Cape Cod Family Prope | $700,000 | -- |
Source: Public Records
Mortgage History
We collect this data history from publicly available records. To have your information removed, we recommend requesting removal directly through your county’s website.
| Date | Status | Borrower | Loan Amount |
|---|---|---|---|
| Previous Owner | Cape Cod Family Prope | $560,000 |
Source: Public Records
Tax History
| Year | Tax Paid | Tax Assessment Tax Assessment Total Assessment is a certain percentage of the fair market value that is determined by local assessors to be the total taxable value of land and additions on the property. | Land | Improvement |
|---|---|---|---|---|
| 2025 | $10,762 | $1,164,700 | $850,000 | $314,700 |
| 2024 | $11,138 | $1,271,500 | $973,600 | $297,900 |
| 2023 | $10,177 | $1,133,300 | $871,000 | $262,300 |
| 2022 | $7,539 | $675,500 | $457,900 | $217,600 |
| 2021 | $7,444 | $635,700 | $457,900 | $177,800 |
| 2020 | $7,561 | $616,700 | $457,900 | $158,800 |
| 2019 | $7,050 | $576,900 | $437,100 | $139,800 |
| 2018 | $7,578 | $602,400 | $482,000 | $120,400 |
| 2017 | $7,441 | $595,300 | $482,000 | $113,300 |
| 2016 | $8,257 | $669,700 | $563,600 | $106,100 |
| 2015 | $8,030 | $663,100 | $549,100 | $114,000 |
Source: Public Records
Map
Nearby Homes
- 0 Indian Trail
- 124 Old Jail Ln
- 30 Indian Trail
- 122 Salt Rock Rd
- 55 Tonela Ln
- 93 Harris Meadow Ln
- 79 Bayberry Ln
- 320 Braggs Ln
- 11 Shepherds Way
- 280 Harbor Point Rd
- 12 van Duzer Rd Unit 8
- 122 Stoney Cove Ln
- 44 Iris Ln
- 61 Old Phinneys Ln
- 218 Oakmont Rd
- 45 Old Phinney's Ln
- 4332 Main St
- 97 Oakmont Dr
- 4390 Main St
- 93 Oakmont Dr Unit Lot 2
Your Personal Tour Guide
Ask me questions while you tour the home.