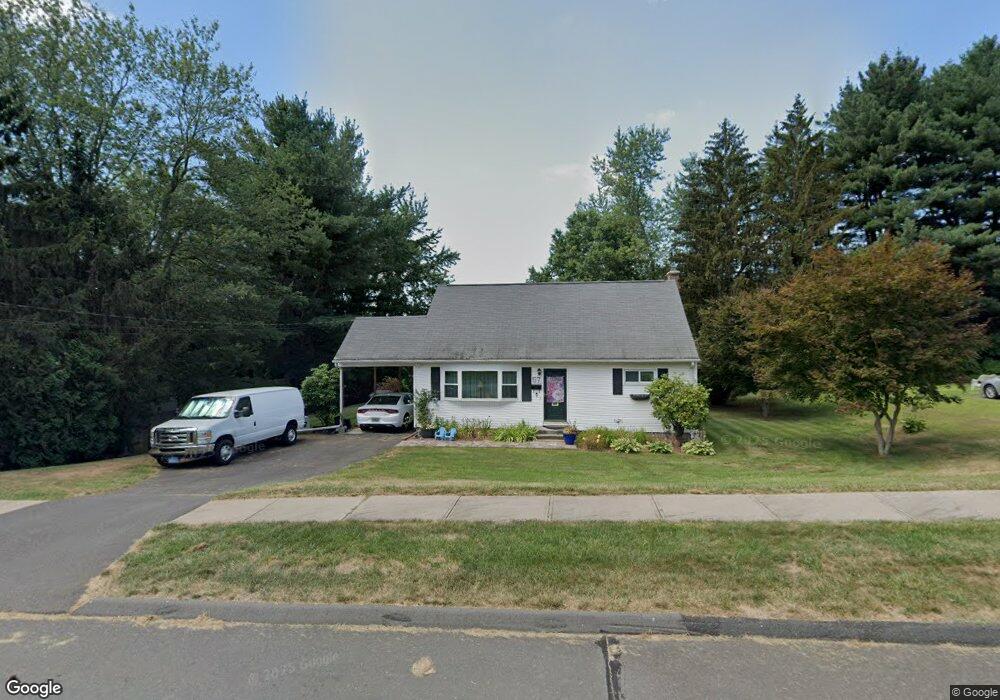
57 Brett Ln Enfield, CT 06082
Estimated Value: $299,000 - $313,000
3
Beds
2
Baths
1,260
Sq Ft
$241/Sq Ft
Est. Value
About This Home
This home is located at 57 Brett Ln, Enfield, CT 06082 and is currently estimated at $303,093, approximately $240 per square foot. 57 Brett Ln is a home located in Hartford County with nearby schools including Nathan Hale Elementary School, Eli Whitney Elementary School, and John F. Kennedy Middle School.
Ownership History
Date
Name
Owned For
Owner Type
Purchase Details
Closed on
Aug 6, 2003
Sold by
South Street Group Llc
Bought by
Cass Melissa
Current Estimated Value
Home Financials for this Owner
Home Financials are based on the most recent Mortgage that was taken out on this home.
Original Mortgage
$143,700
Outstanding Balance
$61,711
Interest Rate
5.28%
Estimated Equity
$241,382
Purchase Details
Closed on
Mar 27, 2003
Sold by
Arthur Hindsi and Mireka Cynthia
Bought by
South St Grp Llc
Create a Home Valuation Report for This Property
The Home Valuation Report is an in-depth analysis detailing your home's value as well as a comparison with similar homes in the area
Home Values in the Area
Average Home Value in this Area
Purchase History
| Date | Buyer | Sale Price | Title Company |
|---|---|---|---|
| Cass Melissa | $146,000 | -- | |
| South St Grp Llc | $123,000 | -- |
Source: Public Records
Mortgage History
| Date | Status | Borrower | Loan Amount |
|---|---|---|---|
| Open | South St Grp Llc | $143,700 |
Source: Public Records
Tax History Compared to Growth
Tax History
| Year | Tax Paid | Tax Assessment Tax Assessment Total Assessment is a certain percentage of the fair market value that is determined by local assessors to be the total taxable value of land and additions on the property. | Land | Improvement |
|---|---|---|---|---|
| 2025 | $4,819 | $137,300 | $53,800 | $83,500 |
| 2024 | $4,642 | $137,300 | $53,800 | $83,500 |
| 2023 | $4,608 | $137,300 | $53,800 | $83,500 |
| 2022 | $4,241 | $137,300 | $53,800 | $83,500 |
| 2021 | $4,036 | $107,430 | $44,550 | $62,880 |
| 2020 | $4,009 | $107,430 | $44,550 | $62,880 |
| 2019 | $4,004 | $107,430 | $44,550 | $62,880 |
| 2018 | $3,896 | $107,430 | $44,550 | $62,880 |
| 2017 | $3,661 | $107,430 | $44,550 | $62,880 |
| 2016 | $3,570 | $107,020 | $45,710 | $61,310 |
| 2015 | $3,461 | $107,020 | $45,710 | $61,310 |
| 2014 | $3,374 | $107,020 | $45,710 | $61,310 |
Source: Public Records
Map
Nearby Homes
- 436 Taylor Rd
- 155 Sheridan Rd
- 31 Meade Ln
- 2 Meacham Dr Unit 2
- 11 Northfield Rd
- 4 Copley Cir
- 34 Ridgefield Rd
- 56 N Maple St
- 102 N Maple St Unit 1A
- 6 Cedar St
- 138 Main St
- 287 Hazard Ave
- 35 Therese Dr
- 12 Salerno Dr
- 45 Monroe Rd
- 3 Avon Street Extension
- 85 Oldefield Farms Unit 85
- 83 Oldefield Farms Unit 83
- 12 the Laurels Unit 12
- 181 Candlewood Dr Unit 181