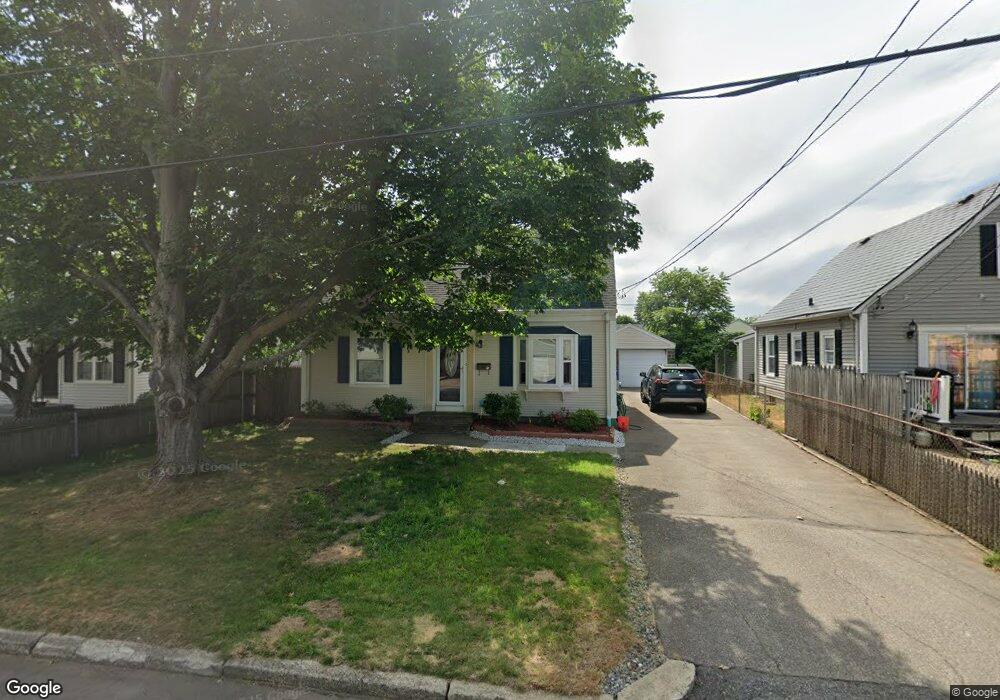
57 Burgess Ave Pawtucket, RI 02861
Darlington NeighborhoodEstimated Value: $396,348 - $415,000
3
Beds
2
Baths
1,365
Sq Ft
$296/Sq Ft
Est. Value
About This Home
This home is located at 57 Burgess Ave, Pawtucket, RI 02861 and is currently estimated at $404,587, approximately $296 per square foot. 57 Burgess Ave is a home located in Providence County with nearby schools including Saint Teresa Catholic Elementary School, St Cecilia School, and Saint Raphael Academy.
Ownership History
Date
Name
Owned For
Owner Type
Purchase Details
Closed on
Oct 31, 1995
Sold by
Ross Brian D and Ross Andrea
Bought by
Mohammed Nazim and Mohammed Aleida
Current Estimated Value
Home Financials for this Owner
Home Financials are based on the most recent Mortgage that was taken out on this home.
Original Mortgage
$100,700
Interest Rate
7.6%
Create a Home Valuation Report for This Property
The Home Valuation Report is an in-depth analysis detailing your home's value as well as a comparison with similar homes in the area
Home Values in the Area
Average Home Value in this Area
Purchase History
| Date | Buyer | Sale Price | Title Company |
|---|---|---|---|
| Mohammed Nazim | $106,000 | -- |
Source: Public Records
Mortgage History
| Date | Status | Borrower | Loan Amount |
|---|---|---|---|
| Closed | Mohammed Nazim | $15,000 | |
| Open | Mohammed Nazim | $93,000 | |
| Closed | Mohammed Nazim | $100,700 |
Source: Public Records
Tax History Compared to Growth
Tax History
| Year | Tax Paid | Tax Assessment Tax Assessment Total Assessment is a certain percentage of the fair market value that is determined by local assessors to be the total taxable value of land and additions on the property. | Land | Improvement |
|---|---|---|---|---|
| 2025 | $4,188 | $318,500 | $126,600 | $191,900 |
| 2024 | $3,930 | $318,500 | $126,600 | $191,900 |
| 2023 | $4,191 | $247,400 | $85,100 | $162,300 |
| 2022 | $4,102 | $247,400 | $85,100 | $162,300 |
| 2021 | $4,102 | $247,400 | $85,100 | $162,300 |
| 2020 | $3,980 | $190,500 | $70,300 | $120,200 |
| 2019 | $3,980 | $190,500 | $70,300 | $120,200 |
| 2018 | $3,835 | $190,500 | $70,300 | $120,200 |
| 2017 | $3,722 | $163,800 | $63,700 | $100,100 |
| 2016 | $3,586 | $163,800 | $63,700 | $100,100 |
| 2015 | $3,586 | $163,800 | $63,700 | $100,100 |
| 2014 | $3,397 | $147,300 | $60,800 | $86,500 |
Source: Public Records
Map
Nearby Homes