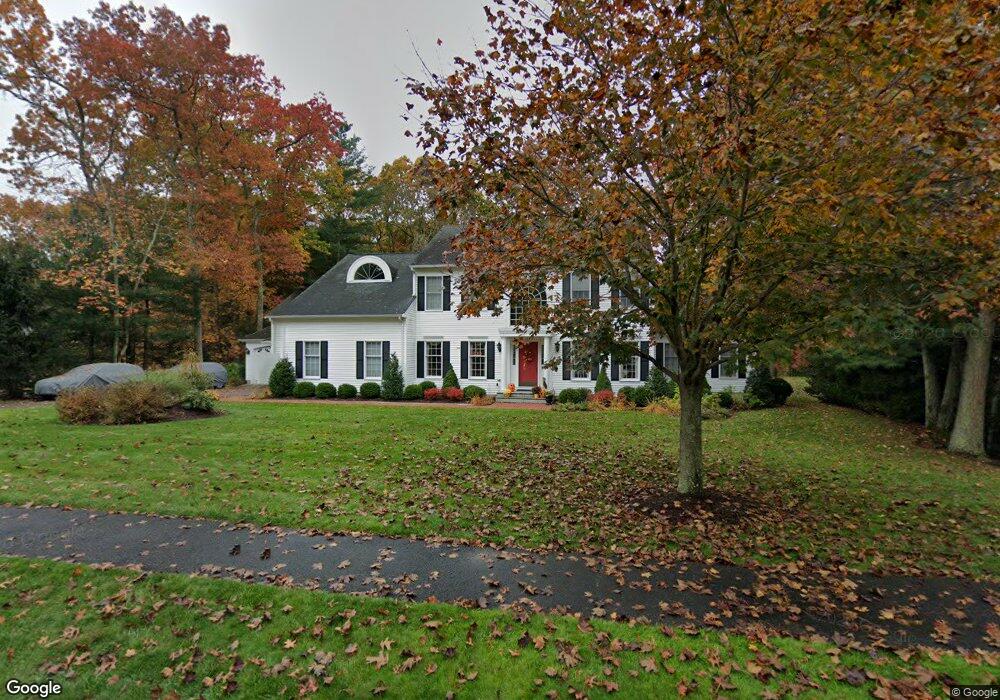
57 Charles River Dr Franklin, MA 02038
Estimated Value: $1,163,865 - $1,303,000
4
Beds
5
Baths
3,656
Sq Ft
$336/Sq Ft
Est. Value
About This Home
This home is located at 57 Charles River Dr, Franklin, MA 02038 and is currently estimated at $1,226,716, approximately $335 per square foot. 57 Charles River Dr is a home located in Norfolk County with nearby schools including Oak Street Elementary School, Horace Mann Middle School, and Franklin High School.
Ownership History
Date
Name
Owned For
Owner Type
Purchase Details
Closed on
Mar 22, 2002
Sold by
Farrand Michael D and Farrand Karen M
Bought by
Dunlap Christian P and Dunlap Shari L
Current Estimated Value
Home Financials for this Owner
Home Financials are based on the most recent Mortgage that was taken out on this home.
Original Mortgage
$300,000
Outstanding Balance
$123,995
Interest Rate
6.91%
Mortgage Type
Purchase Money Mortgage
Estimated Equity
$1,102,721
Purchase Details
Closed on
Aug 18, 1995
Sold by
Franlin Farms Lp
Bought by
Deem Charles E
Home Financials for this Owner
Home Financials are based on the most recent Mortgage that was taken out on this home.
Original Mortgage
$255,050
Interest Rate
7.61%
Mortgage Type
Purchase Money Mortgage
Create a Home Valuation Report for This Property
The Home Valuation Report is an in-depth analysis detailing your home's value as well as a comparison with similar homes in the area
Home Values in the Area
Average Home Value in this Area
Purchase History
| Date | Buyer | Sale Price | Title Company |
|---|---|---|---|
| Dunlap Christian P | $549,900 | -- | |
| Deem Charles E | $283,429 | -- |
Source: Public Records
Mortgage History
| Date | Status | Borrower | Loan Amount |
|---|---|---|---|
| Open | Deem Charles E | $60,000 | |
| Open | Dunlap Christian P | $300,000 | |
| Previous Owner | Deem Charles E | $254,000 | |
| Previous Owner | Deem Charles E | $255,050 |
Source: Public Records
Tax History Compared to Growth
Tax History
| Year | Tax Paid | Tax Assessment Tax Assessment Total Assessment is a certain percentage of the fair market value that is determined by local assessors to be the total taxable value of land and additions on the property. | Land | Improvement |
|---|---|---|---|---|
| 2025 | $11,275 | $970,300 | $368,000 | $602,300 |
| 2024 | $11,440 | $970,300 | $368,000 | $602,300 |
| 2023 | $11,189 | $889,400 | $341,400 | $548,000 |
| 2022 | $10,944 | $778,900 | $294,400 | $484,500 |
| 2021 | $10,511 | $717,500 | $282,200 | $435,300 |
| 2020 | $10,150 | $699,500 | $285,000 | $414,500 |
| 2019 | $10,212 | $696,600 | $282,200 | $414,400 |
| 2018 | $9,552 | $652,000 | $279,300 | $372,700 |
| 2017 | $9,632 | $660,600 | $287,900 | $372,700 |
| 2016 | $8,958 | $617,800 | $249,300 | $368,500 |
| 2015 | $9,024 | $608,100 | $240,500 | $367,600 |
| 2014 | $8,499 | $588,200 | $220,600 | $367,600 |
Source: Public Records
Map
Nearby Homes
- 336 Maple St
- 2 Kayla Dr
- 208 Irondequoit Rd
- 41 Kimberlee Ave
- 159 Highwood Dr
- 66 Highwood Dr
- 83 Highwood Dr Unit 83
- 31 Highwood Dr
- 2 Noanet Brook Ln
- 2211 Franklin Crossing Rd Unit 2211
- 1805 Franklin Crossing Rd
- 605 Franklin Crossing Rd
- 57 Raymond St Unit 2
- 204 Lincoln St
- 60 Southgate Rd
- 17 Longhill Rd
- 48 Pinehurst St
- 14 Pleasant St Unit A
- 6 Buena Vista Dr
- 0 Upper Union St Unit 73230551
- 55 Charles River Dr
- 59 Charles River Dr
- 52 Charles River Dr
- 53 Charles River Dr
- 61 Charles River Dr
- 50 Charles River Dr
- 56 Charles River Dr
- 48 Charles River Dr
- 51 Charles River Dr
- 62 Charles River Dr
- 64 Charles River Dr
- 60 Charles River Dr
- 66 Charles River Dr
- 58 Charles River Dr
- 1 Harlow Pond Ct
- 46 Charles River Dr
- 2 Harlow Pond Ct
- 68 Charles River Dr
- 63 Charles River Dr
- 49 Charles River Dr