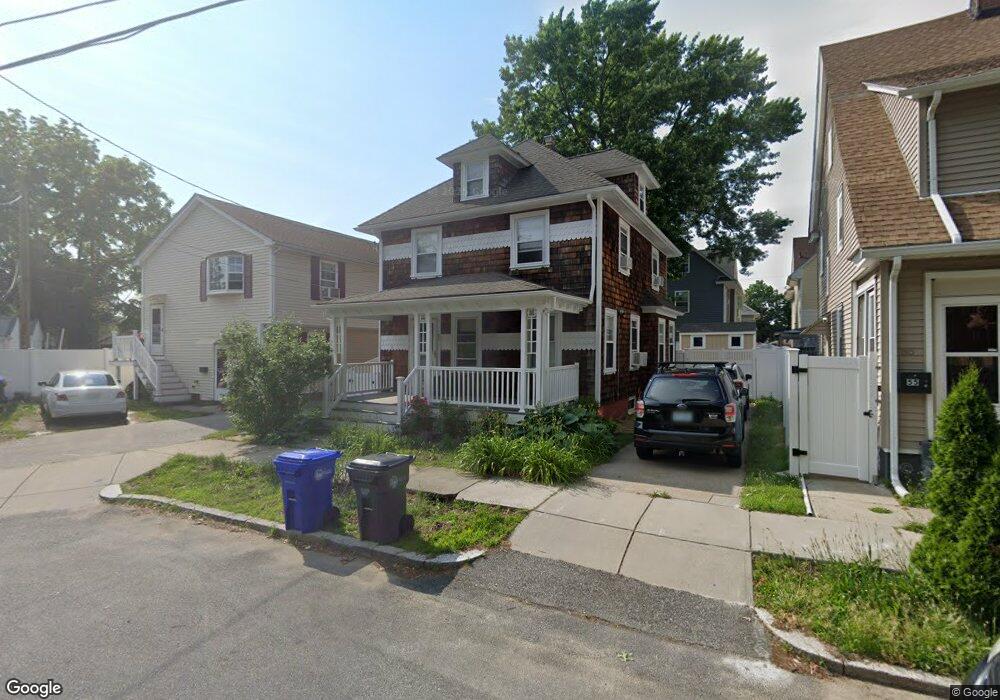
57 Cyr St Cranston, RI 02905
Washington Park NeighborhoodEstimated Value: $383,000 - $447,000
3
Beds
1
Bath
1,623
Sq Ft
$248/Sq Ft
Est. Value
About This Home
This home is located at 57 Cyr St, Cranston, RI 02905 and is currently estimated at $402,204, approximately $247 per square foot. 57 Cyr St is a home located in Providence County with nearby schools including Asa Messer Elementary School, Charles N. Fortes Elementary School, and Alan Shawn Feinstein Elementary.
Ownership History
Date
Name
Owned For
Owner Type
Purchase Details
Closed on
Mar 28, 2001
Sold by
Therriault Thomas N and Therriault Judith A
Bought by
Leimer Kimberly U
Current Estimated Value
Home Financials for this Owner
Home Financials are based on the most recent Mortgage that was taken out on this home.
Original Mortgage
$115,307
Interest Rate
6.96%
Create a Home Valuation Report for This Property
The Home Valuation Report is an in-depth analysis detailing your home's value as well as a comparison with similar homes in the area
Home Values in the Area
Average Home Value in this Area
Purchase History
| Date | Buyer | Sale Price | Title Company |
|---|---|---|---|
| Leimer Kimberly U | $87,000 | -- |
Source: Public Records
Mortgage History
| Date | Status | Borrower | Loan Amount |
|---|---|---|---|
| Open | Leimer Kimberly U | $162,988 | |
| Closed | Leimer Kimberly U | $25,000 | |
| Closed | Leimer Kimberly U | $180,000 | |
| Closed | Leimer Kimberly U | $115,307 |
Source: Public Records
Tax History Compared to Growth
Tax History
| Year | Tax Paid | Tax Assessment Tax Assessment Total Assessment is a certain percentage of the fair market value that is determined by local assessors to be the total taxable value of land and additions on the property. | Land | Improvement |
|---|---|---|---|---|
| 2025 | $3,038 | $361,700 | $118,800 | $242,900 |
| 2024 | $4,606 | $251,000 | $75,300 | $175,700 |
| 2023 | $4,606 | $251,000 | $75,300 | $175,700 |
| 2022 | $4,468 | $251,000 | $75,300 | $175,700 |
| 2021 | $3,880 | $158,000 | $33,200 | $124,800 |
| 2020 | $3,880 | $158,000 | $33,200 | $124,800 |
| 2019 | $3,880 | $158,000 | $33,200 | $124,800 |
| 2018 | $3,538 | $110,700 | $30,200 | $80,500 |
| 2017 | $3,538 | $110,700 | $30,200 | $80,500 |
| 2016 | $3,538 | $110,700 | $30,200 | $80,500 |
| 2015 | $3,555 | $107,400 | $30,200 | $77,200 |
| 2014 | $3,625 | $107,400 | $30,200 | $77,200 |
| 2013 | $3,625 | $107,400 | $30,200 | $77,200 |
Source: Public Records
Map
Nearby Homes
- 61 Cyr St
- 37 Farragut Ave
- 55 Homer St
- 312 California Ave
- 52 Cactus St
- 50 Cactus St
- 274 Montgomery Ave
- 356 Smith St
- 36 Bernard St
- 263 California Ave
- 321 Smith St
- 255 Ohio Ave
- 139 Babcock St
- 26 Spicer St
- 236 Vermont Ave
- 232 Massachusetts Ave
- 35 Spicer St
- 228 Washington Ave
- 300 Northup St
- 28 Verndale Ave
- 55 Cyr St
- 56 Farragut Ave
- 52 Farragut Ave
- 49 Cyr St
- 60 Farragut Ave
- 64 Farragut Ave
- 48 Farragut Ave
- 393 Montgomery Ave
- 41 Cyr St
- 68 Farragut Ave
- 397 Montgomery Ave
- 44 Farragut Ave
- 403 Montgomery Ave
- 37 Cyr St
- 72 Farragut Ave
- 40 Farragut Ave
- 57 Farragut Ave
- 409 Montgomery Ave
- 33 Cyr St
- 61 Farragut Ave