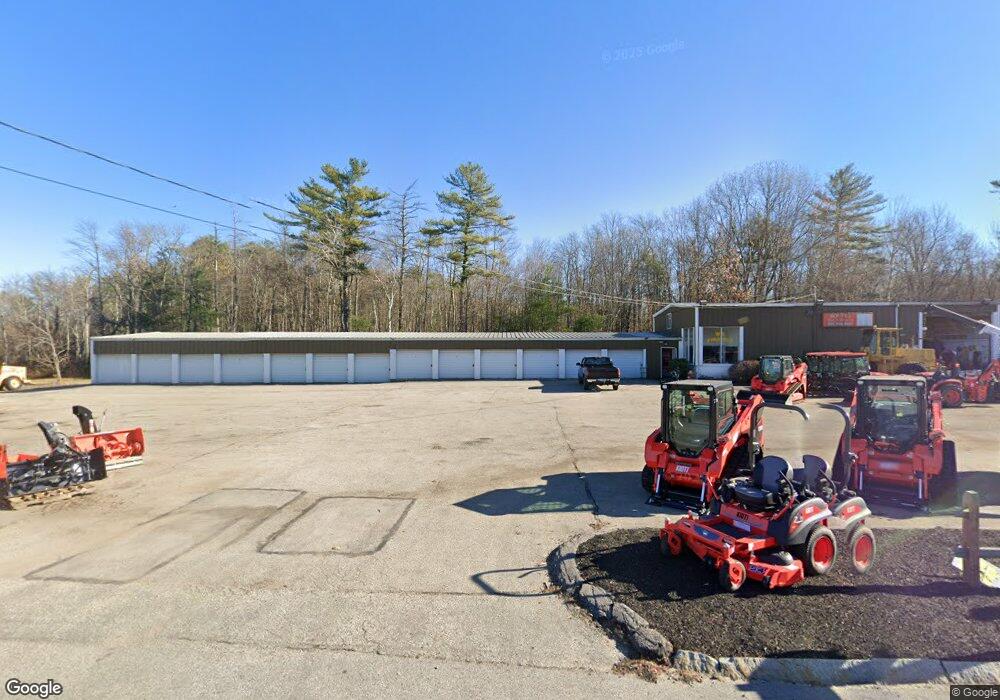
57 Lafayette Rd North Hampton, NH 03862
Estimated Value: $1,606,397
--
Bed
--
Bath
2,400
Sq Ft
$669/Sq Ft
Est. Value
About This Home
This home is located at 57 Lafayette Rd, North Hampton, NH 03862 and is currently estimated at $1,606,397, approximately $669 per square foot. 57 Lafayette Rd is a home located in Rockingham County with nearby schools including North Hampton School, Winnacunnet High School, and Sacred Heart School.
Ownership History
Date
Name
Owned For
Owner Type
Purchase Details
Closed on
Mar 16, 2017
Sold by
D & E Realty Llc
Bought by
Batch Realty Llc
Current Estimated Value
Home Financials for this Owner
Home Financials are based on the most recent Mortgage that was taken out on this home.
Original Mortgage
$400,000
Outstanding Balance
$331,886
Interest Rate
4.19%
Mortgage Type
Commercial
Estimated Equity
$1,274,511
Purchase Details
Closed on
Sep 26, 2006
Sold by
Dupuis Lisa L and Dupuis Wayne J
Bought by
Loud Colleen O
Purchase Details
Closed on
Jun 1, 2001
Sold by
Tuholski Donald L
Bought by
D & H Rlty Llc
Home Financials for this Owner
Home Financials are based on the most recent Mortgage that was taken out on this home.
Original Mortgage
$500,000
Interest Rate
7.09%
Mortgage Type
Commercial
Create a Home Valuation Report for This Property
The Home Valuation Report is an in-depth analysis detailing your home's value as well as a comparison with similar homes in the area
Home Values in the Area
Average Home Value in this Area
Purchase History
| Date | Buyer | Sale Price | Title Company |
|---|---|---|---|
| Batch Realty Llc | $800,000 | -- | |
| Loud Colleen O | $94,000 | -- | |
| D & H Rlty Llc | $525,000 | -- |
Source: Public Records
Mortgage History
| Date | Status | Borrower | Loan Amount |
|---|---|---|---|
| Open | Batch Realty Llc | $400,000 | |
| Previous Owner | D & H Rlty Llc | $485,000 | |
| Previous Owner | D & H Rlty Llc | $500,000 |
Source: Public Records
Tax History Compared to Growth
Tax History
| Year | Tax Paid | Tax Assessment Tax Assessment Total Assessment is a certain percentage of the fair market value that is determined by local assessors to be the total taxable value of land and additions on the property. | Land | Improvement |
|---|---|---|---|---|
| 2024 | $10,310 | $805,500 | $446,200 | $359,300 |
| 2023 | $10,028 | $805,500 | $446,200 | $359,300 |
| 2022 | $11,832 | $689,100 | $351,000 | $338,100 |
| 2021 | $11,418 | $689,100 | $351,000 | $338,100 |
| 2020 | $11,653 | $689,100 | $351,000 | $338,100 |
| 2019 | $11,829 | $708,300 | $351,000 | $357,300 |
| 2018 | $11,503 | $708,300 | $351,000 | $357,300 |
| 2017 | $10,717 | $579,300 | $351,000 | $228,300 |
| 2016 | $10,306 | $579,300 | $351,000 | $228,300 |
| 2015 | $10,283 | $588,300 | $351,000 | $237,300 |
| 2014 | $10,031 | $588,300 | $351,000 | $237,300 |
| 2013 | $9,854 | $588,300 | $351,000 | $237,300 |
Source: Public Records
Map
Nearby Homes
- 61 Lafayette Rd
- 55 Lafayette Rd
- 65 Lafayette Rd
- 65 Lafayette Rd Unit 302
- 64 Lafayette Road Unit11
- 56 Lafayette Rd
- 64 Lafayette Road - Suite2 3
- 64 Lafayette (Unit 4)
- 64 Lafayette Rd
- 64 Lafayette Rd
- 64 Lafayette Rd
- 64 Lafayette Rd Unit 3
- 64 Lafayette Rd Unit 4
- 64 Lafayette Rd Unit 9
- 64 Lafayette Rd Unit 12
- 64 Lafayette Rd Unit 8
- 64 Lafayette Rd Unit 11
- 64 Lafayette Rd Unit 2/3
- 64 Lafayette Rd Unit 13
- 60 Lafayette Rd