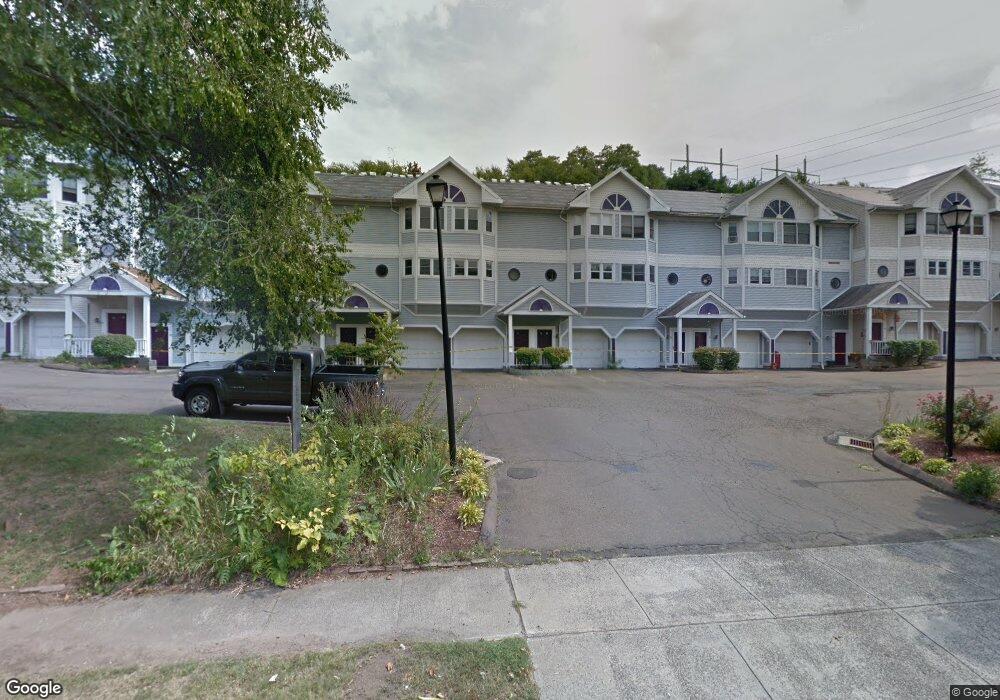
57 Quinnipiac Ave New Haven, CT 06513
Fair Haven Heights NeighborhoodEstimated Value: $210,000 - $246,105
2
Beds
2
Baths
1,300
Sq Ft
$172/Sq Ft
Est. Value
About This Home
This home is located at 57 Quinnipiac Ave, New Haven, CT 06513 and is currently estimated at $224,026, approximately $172 per square foot. 57 Quinnipiac Ave is a home located in New Haven County with nearby schools including Ross Woodward, Cold Spring School, and St Francis & St Rose Of Lima School.
Ownership History
Date
Name
Owned For
Owner Type
Purchase Details
Closed on
Sep 17, 2013
Sold by
Fnma
Bought by
Calle Jose L
Current Estimated Value
Purchase Details
Closed on
Jun 26, 2013
Sold by
Lamoureux Rose E and Dimunno James A
Bought by
Federal National Mortgage Association
Purchase Details
Closed on
Jun 23, 2008
Sold by
Hwang Jong Pil
Bought by
Dimunno James and Lamoureux Rose
Home Financials for this Owner
Home Financials are based on the most recent Mortgage that was taken out on this home.
Original Mortgage
$147,200
Interest Rate
6.1%
Purchase Details
Closed on
Apr 7, 1997
Sold by
Townsend Commons Llc
Bought by
Chyung Sun and Hwang Jong P
Home Financials for this Owner
Home Financials are based on the most recent Mortgage that was taken out on this home.
Original Mortgage
$55,000
Interest Rate
7.5%
Mortgage Type
Unknown
Create a Home Valuation Report for This Property
The Home Valuation Report is an in-depth analysis detailing your home's value as well as a comparison with similar homes in the area
Home Values in the Area
Average Home Value in this Area
Purchase History
| Date | Buyer | Sale Price | Title Company |
|---|---|---|---|
| Calle Jose L | $85,000 | -- | |
| Federal National Mortgage Association | -- | -- | |
| Dimunno James | $184,000 | -- | |
| Chyung Sun | $62,000 | -- |
Source: Public Records
Mortgage History
| Date | Status | Borrower | Loan Amount |
|---|---|---|---|
| Previous Owner | Chyung Sun | $147,200 | |
| Previous Owner | Chyung Sun | $55,000 |
Source: Public Records
Tax History Compared to Growth
Tax History
| Year | Tax Paid | Tax Assessment Tax Assessment Total Assessment is a certain percentage of the fair market value that is determined by local assessors to be the total taxable value of land and additions on the property. | Land | Improvement |
|---|---|---|---|---|
| 2025 | $3,977 | $100,940 | $0 | $100,940 |
| 2024 | $3,886 | $100,940 | $0 | $100,940 |
| 2023 | $3,755 | $100,940 | $0 | $100,940 |
| 2022 | $4,012 | $100,940 | $0 | $100,940 |
| 2021 | $4,257 | $97,020 | $0 | $97,020 |
| 2020 | $4,257 | $97,020 | $0 | $97,020 |
| 2019 | $4,170 | $97,020 | $0 | $97,020 |
| 2018 | $4,170 | $97,020 | $0 | $97,020 |
| 2017 | $3,753 | $97,020 | $0 | $97,020 |
| 2016 | $4,293 | $103,320 | $0 | $103,320 |
| 2015 | $4,293 | $103,320 | $0 | $103,320 |
| 2014 | $4,293 | $103,320 | $0 | $103,320 |
Source: Public Records
Map
Nearby Homes
- 20 Ashland Place
- 28 Farren Ave
- 74 Milton St
- 172 Quinnipiac Ave
- 334 Prospect Ave Unit 334
- 225 Fulton Terrace
- 1117 Townsend Ave
- 1090 Townsend Ave
- 190 Farren Ave
- 193 Farren Ave
- 666 Woodward Ave Unit 666
- 196 Farren Ave
- 12 E Ferry St
- 95 Lenox St Unit L
- 120 Harrington Ave
- 121 Lexington Ave Unit 21
- 112 Harrington Ave
- 44 Huntington Ave
- 45 Huntington Ave
- 32 Huntington Ave
- 37 Quinnipiac Ave
- 39 Quinnipiac Ave
- 41 Quinnipiac Ave
- 43 Quinnipiac Ave
- 45 Quinnipiac Ave
- 47 Quinnipiac Ave
- 49 Quinnipiac Ave
- 51 Quinnipiac Ave
- 53 Quinnipiac Ave
- 55 Quinnipiac Ave
- 59 Quinnipiac Ave
- 61 Quinnipiac Ave
- 63 Quinnipiac Ave
- 65 Quinnipiac Ave
- 67 Quinnipiac Ave
- 49 Quinnipiac Ave Unit 49
- 43 Quinnipiac Ave Unit 43
- 41 Quinnipiac Ave Unit 41
- 57 Quinnipiac Ave Unit 57
- 47 Quinnipiac Ave Unit 47