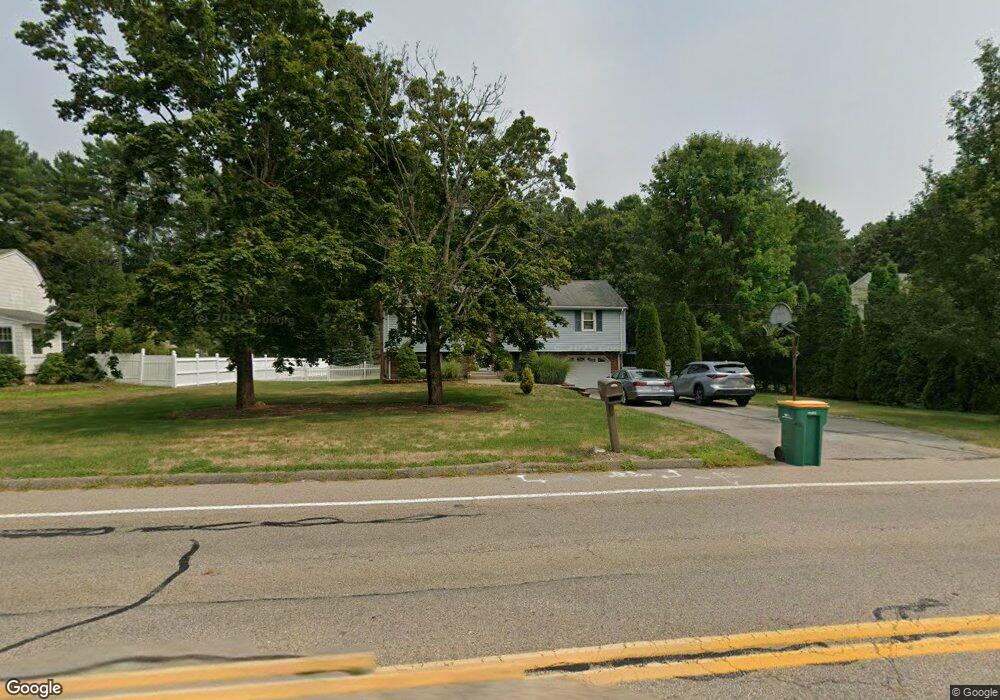
570 Elm St Mansfield, MA 02048
Estimated Value: $595,110 - $772,000
3
Beds
2
Baths
1,132
Sq Ft
$576/Sq Ft
Est. Value
About This Home
This home is located at 570 Elm St, Mansfield, MA 02048 and is currently estimated at $651,528, approximately $575 per square foot. 570 Elm St is a home located in Bristol County with nearby schools including Everett W. Robinson Elementary School, Jordan/Jackson Elementary School, and Harold L. Qualters Middle School.
Ownership History
Date
Name
Owned For
Owner Type
Purchase Details
Closed on
Jun 15, 2001
Sold by
Marston Lawrence D and Marston Nancy J
Bought by
Marston Lawrence D
Current Estimated Value
Home Financials for this Owner
Home Financials are based on the most recent Mortgage that was taken out on this home.
Original Mortgage
$160,000
Interest Rate
7.15%
Mortgage Type
Purchase Money Mortgage
Create a Home Valuation Report for This Property
The Home Valuation Report is an in-depth analysis detailing your home's value as well as a comparison with similar homes in the area
Home Values in the Area
Average Home Value in this Area
Purchase History
| Date | Buyer | Sale Price | Title Company |
|---|---|---|---|
| Marston Lawrence D | $200,000 | -- |
Source: Public Records
Mortgage History
| Date | Status | Borrower | Loan Amount |
|---|---|---|---|
| Open | Marston Lawrence D | $200,000 | |
| Closed | Marston Lawrence D | $160,000 | |
| Previous Owner | Marston Lawrence D | $65,800 |
Source: Public Records
Tax History
| Year | Tax Paid | Tax Assessment Tax Assessment Total Assessment is a certain percentage of the fair market value that is determined by local assessors to be the total taxable value of land and additions on the property. | Land | Improvement |
|---|---|---|---|---|
| 2025 | $7,319 | $555,700 | $255,700 | $300,000 |
| 2024 | $6,885 | $510,000 | $255,700 | $254,300 |
| 2023 | $6,751 | $479,100 | $255,700 | $223,400 |
| 2022 | $6,546 | $431,500 | $237,000 | $194,500 |
| 2021 | $0 | $397,800 | $207,200 | $190,600 |
| 2020 | $2,129 | $392,900 | $197,400 | $195,500 |
| 2019 | $2,897 | $360,200 | $164,700 | $195,500 |
| 2018 | $1,849 | $338,200 | $157,300 | $180,900 |
| 2017 | $2,862 | $337,200 | $153,000 | $184,200 |
| 2016 | $5,005 | $324,800 | $145,500 | $179,300 |
| 2015 | $4,658 | $300,500 | $145,500 | $155,000 |
Source: Public Records
Map
Nearby Homes
- 2 Oak St Unit 2A
- 2 Oak St Unit 2B
- 37 Oakleaf Dr
- 451R Gilbert St
- 14 Claire Ave
- 71 Richardson Ave
- 14 Country Club Way
- 143 Oak St Unit 10
- 250 Mansfield Ave Unit 11
- 343 Godfrey Dr
- 10 Walter St
- 150 Gilbert St
- 65 Godfrey Dr Unit 65
- 95 Godfrey Dr
- 49 Pheasant Hill Rd
- 20 John F. Kennedy Dr
- 85 Jewell St
- 345 Richardson Ave
- 157 Mansfield Ave Unit 14
- 263 Mansfield Rd
Your Personal Tour Guide
Ask me questions while you tour the home.