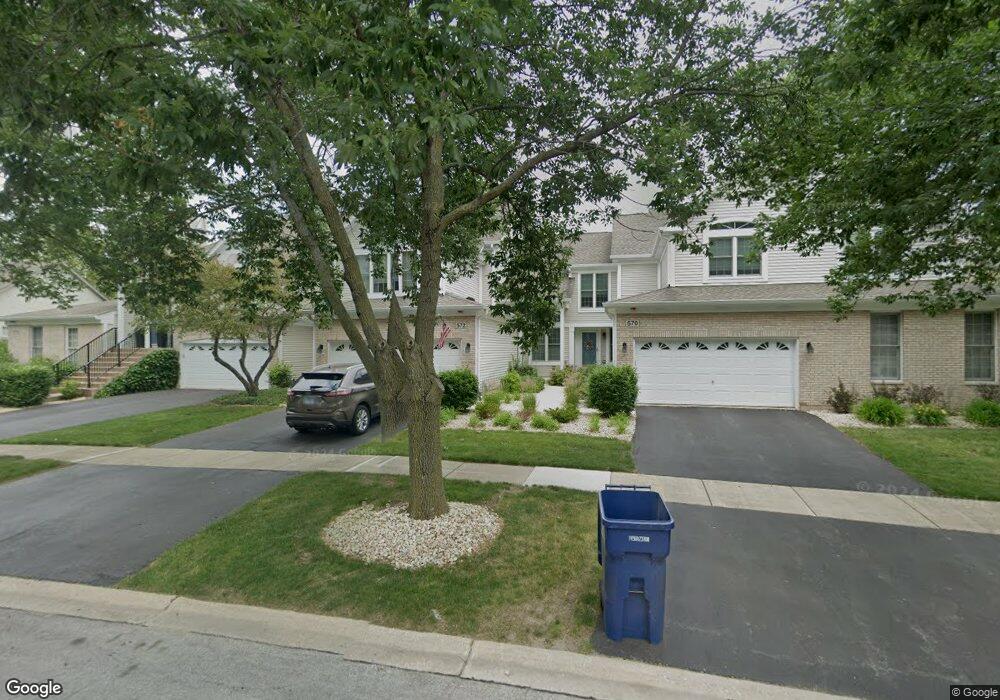
570 Harlowe Ln Unit 1504C Naperville, IL 60565
Meadow Glens NeighborhoodEstimated Value: $420,314 - $537,000
--
Bed
2
Baths
1,829
Sq Ft
$247/Sq Ft
Est. Value
About This Home
This home is located at 570 Harlowe Ln Unit 1504C, Naperville, IL 60565 and is currently estimated at $451,579, approximately $246 per square foot. 570 Harlowe Ln Unit 1504C is a home located in DuPage County with nearby schools including Maplebrook Elementary School, Lincoln Jr. High School, and Naperville Central High School.
Ownership History
Date
Name
Owned For
Owner Type
Purchase Details
Closed on
Oct 20, 2021
Sold by
Rynes Rochelle and Roeske Rochelle
Bought by
Rynes Rochelle and Rochelle Rynes Trust
Current Estimated Value
Purchase Details
Closed on
Jun 27, 2003
Sold by
Cal Cosky Christina
Bought by
Roeske Rochelle
Home Financials for this Owner
Home Financials are based on the most recent Mortgage that was taken out on this home.
Original Mortgage
$220,000
Outstanding Balance
$94,519
Interest Rate
5.4%
Mortgage Type
Purchase Money Mortgage
Estimated Equity
$357,060
Purchase Details
Closed on
Jun 11, 1995
Sold by
Wiseman Hughes Enterprises Inc
Bought by
Cal Cosky Christina
Home Financials for this Owner
Home Financials are based on the most recent Mortgage that was taken out on this home.
Original Mortgage
$115,400
Interest Rate
7.5%
Mortgage Type
Purchase Money Mortgage
Create a Home Valuation Report for This Property
The Home Valuation Report is an in-depth analysis detailing your home's value as well as a comparison with similar homes in the area
Home Values in the Area
Average Home Value in this Area
Purchase History
| Date | Buyer | Sale Price | Title Company |
|---|---|---|---|
| Rynes Rochelle | -- | Accommodation | |
| Roeske Rochelle | $282,500 | Ctic | |
| Cal Cosky Christina | $184,000 | -- |
Source: Public Records
Mortgage History
| Date | Status | Borrower | Loan Amount |
|---|---|---|---|
| Open | Roeske Rochelle | $220,000 | |
| Previous Owner | Cal Cosky Christina | $115,400 |
Source: Public Records
Tax History Compared to Growth
Tax History
| Year | Tax Paid | Tax Assessment Tax Assessment Total Assessment is a certain percentage of the fair market value that is determined by local assessors to be the total taxable value of land and additions on the property. | Land | Improvement |
|---|---|---|---|---|
| 2024 | $7,474 | $130,005 | $26,713 | $103,292 |
| 2023 | $7,190 | $118,650 | $24,380 | $94,270 |
| 2022 | $6,592 | $107,860 | $22,160 | $85,700 |
| 2021 | $6,347 | $103,780 | $21,320 | $82,460 |
| 2020 | $6,210 | $101,920 | $20,940 | $80,980 |
| 2019 | $6,023 | $97,510 | $20,030 | $77,480 |
| 2018 | $6,101 | $98,670 | $20,270 | $78,400 |
| 2017 | $5,975 | $95,350 | $19,590 | $75,760 |
| 2016 | $5,851 | $91,900 | $18,880 | $73,020 |
| 2015 | $5,806 | $86,540 | $17,780 | $68,760 |
| 2014 | $5,763 | $83,430 | $17,140 | $66,290 |
| 2013 | $5,677 | $83,630 | $17,180 | $66,450 |
Source: Public Records
Map
Nearby Homes
- 1449 Whitespire Ct Unit 5104
- 614 Bakewell Ln
- 456 Timber Trail Ct
- 431 Orleans Ave
- 158 E Bailey Rd Unit F
- 144 E Bailey Rd Unit L
- 128 E Bailey Rd Unit G
- 138 E Bailey Rd Unit M
- 621 Bourbon Ct
- 8S452 Bell Dr
- 1721 S Washington St Unit 1721
- 1751 S Washington St Unit 1
- 1408 Swallow St
- 517 Sheffield Rd
- 1717 Drake Ct
- 1323 Auburn Ave
- 1340 Auburn Ave
- 302 Carriage Hill Rd
- 213 Winding Creek Dr
- 1921 Wisteria Ct Unit 3
- 568 Harlowe Ln Unit 1505
- 572 Harlowe Ln Unit 1503
- 574 Harlowe Ln Unit 1502
- 576 Harlowe Ln Unit 1501
- 562 Harlowe Ln Unit 1601D
- 1537 Treeline Ct Unit 1002
- 1539 Treeline Ct Unit 1001
- 1535 Treeline Ct Unit 1003
- 1533 Treeline Ct Unit 1004
- 560 Harlowe Ln Unit 1602
- 1531 Treeline Ct Unit 1005
- 1547 Treeline Ct Unit 904
- 582 Harlowe Ln Unit 1403
- 569 Harlowe Ln Unit 3101
- 556 Harlowe Ln Unit 1604
- 571 Harlowe Ln Unit 3102
- 573 Harlowe Ln Unit 3103
- 1525 Treeline Ct Unit 1101
- 575 Harlowe Ln Unit 3104
- 577 Harlowe Ln Unit 3105