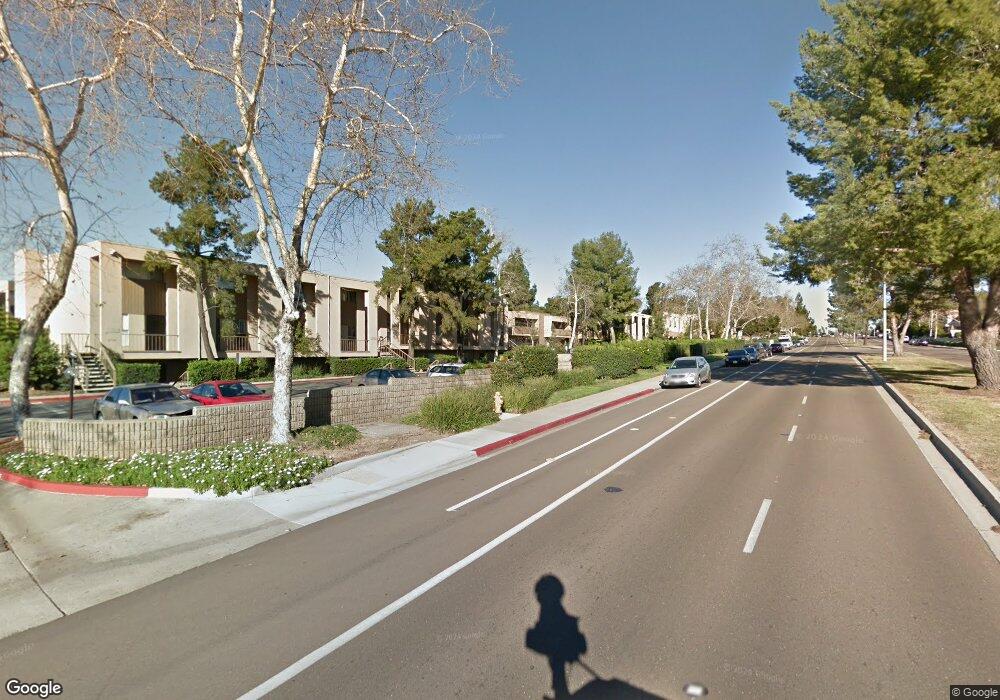
5700 Baltimore Dr Unit 248 La Mesa, CA 91942
Estimated Value: $502,000 - $528,000
2
Beds
3
Baths
1,068
Sq Ft
$482/Sq Ft
Est. Value
About This Home
This home is located at 5700 Baltimore Dr Unit 248, La Mesa, CA 91942 and is currently estimated at $514,639, approximately $481 per square foot. 5700 Baltimore Dr Unit 248 is a home located in San Diego County with nearby schools including Maryland Avenue Elementary School, Parkway Academy, and Grossmont High School.
Ownership History
Date
Name
Owned For
Owner Type
Purchase Details
Closed on
Aug 17, 2016
Sold by
Vaniyants Irina
Bought by
Vaniyants Irina
Current Estimated Value
Purchase Details
Closed on
Jan 30, 2002
Sold by
Morris Monroe and Morris Monika H
Bought by
Vaniyants Irina
Home Financials for this Owner
Home Financials are based on the most recent Mortgage that was taken out on this home.
Original Mortgage
$136,000
Outstanding Balance
$56,513
Interest Rate
7.13%
Mortgage Type
Purchase Money Mortgage
Estimated Equity
$458,126
Purchase Details
Closed on
Dec 28, 2001
Sold by
Schreyer Kirsten A
Bought by
Morris Monroe and Morris Monika H
Home Financials for this Owner
Home Financials are based on the most recent Mortgage that was taken out on this home.
Original Mortgage
$136,000
Outstanding Balance
$56,513
Interest Rate
7.13%
Mortgage Type
Purchase Money Mortgage
Estimated Equity
$458,126
Purchase Details
Closed on
Dec 20, 1996
Sold by
Morris Monroe H and Morris Monika H
Bought by
Morris Monroe and Morris Monika H
Purchase Details
Closed on
Oct 1, 1985
Create a Home Valuation Report for This Property
The Home Valuation Report is an in-depth analysis detailing your home's value as well as a comparison with similar homes in the area
Purchase History
We collect this data history from publicly available records. To have your information removed, we recommend requesting removal directly through your county’s website.
| Date | Buyer | Sale Price | Title Company |
|---|---|---|---|
| Vaniyants Irina | -- | None Available | |
| Vaniyants Irina | $176,000 | Southland Title Company | |
| Morris Monroe | -- | Southland Title | |
| Morris Monroe | -- | -- | |
| -- | $76,000 | -- |
Source: Public Records
Mortgage History
We collect this data history from publicly available records. To have your information removed, we recommend requesting removal directly through your county’s website.
| Date | Status | Borrower | Loan Amount |
|---|---|---|---|
| Open | Vaniyants Irina | $136,000 |
Source: Public Records
Tax History
| Year | Tax Paid | Tax Assessment Tax Assessment Total Assessment is a certain percentage of the fair market value that is determined by local assessors to be the total taxable value of land and additions on the property. | Land | Improvement |
|---|---|---|---|---|
| 2025 | $2,978 | $259,991 | $85,233 | $174,758 |
| 2024 | $2,978 | $254,894 | $83,562 | $171,332 |
| 2023 | $2,891 | $249,897 | $81,924 | $167,973 |
| 2022 | $2,856 | $244,998 | $80,318 | $164,680 |
| 2021 | $2,820 | $240,195 | $78,744 | $161,451 |
| 2020 | $2,732 | $237,733 | $77,937 | $159,796 |
| 2019 | $2,691 | $233,072 | $76,409 | $156,663 |
| 2018 | $2,639 | $228,503 | $74,911 | $153,592 |
| 2017 | $50 | $224,024 | $73,443 | $150,581 |
| 2016 | $2,515 | $219,632 | $72,003 | $147,629 |
| 2015 | $2,497 | $216,334 | $70,922 | $145,412 |
| 2014 | $2,445 | $212,097 | $69,533 | $142,564 |
Source: Public Records
Map
Nearby Homes
- 5700 Baltimore Dr Unit 206
- 5700 Baltimore Dr Unit 225
- 5700 Baltimore Dr Unit 230
- 5700 Baltimore Dr Unit 16
- 5700 Baltimore Dr Unit 195
- 5700 Baltimore Dr Unit 66
- 5715 Baltimore Dr Unit 39
- 5715 Baltimore Dr Unit 23
- 5715 Baltimore Dr Unit 29
- 5710 Baltimore Dr Unit 430
- 5710 Baltimore Dr Unit 427
- 5710 Baltimore Dr Unit 429
- 5712 Baltimore Dr Unit 491
- 5708 Baltimore Dr Unit 402
- 5706 Baltimore Dr Unit 355
- 5704 Baltimore Dr Unit 304
- 5649 Lake Murray Blvd Unit B
- 6060 Cowles Mountain Blvd
- 5985 Zora St
- 5800 Lake Murray Blvd Unit 88
- 5700 Baltimore Dr Unit 208
- 5700 Baltimore Dr Unit 5700 Baltimore Dr Un
- 5700 Baltimore Dr Unit 89
- 5700 Baltimore Dr Unit 162
- 5700 Baltimore Dr Unit 55
- 5700 Baltimore Dr Unit 202
- 5700 Baltimore Dr Unit 20
- 5700 Baltimore Dr Unit 236
- 5700 Baltimore Dr Unit 153
- 5700 Baltimore Dr Unit 5
- 5700 Baltimore Dr Unit 134
- 5700 Baltimore Dr Unit 116
- 5700 Baltimore Dr Unit 30
- 5700 Baltimore Dr Unit 48
- 5700 Baltimore Dr Unit 35
- 5700 Baltimore Dr Unit 145
- 5700 Baltimore Dr Unit 69
- 5700 Baltimore Dr Unit 211
- 5700 Baltimore Dr Unit 139
- 5700 Baltimore Dr Unit 36
Your Personal Tour Guide
Ask me questions while you tour the home.