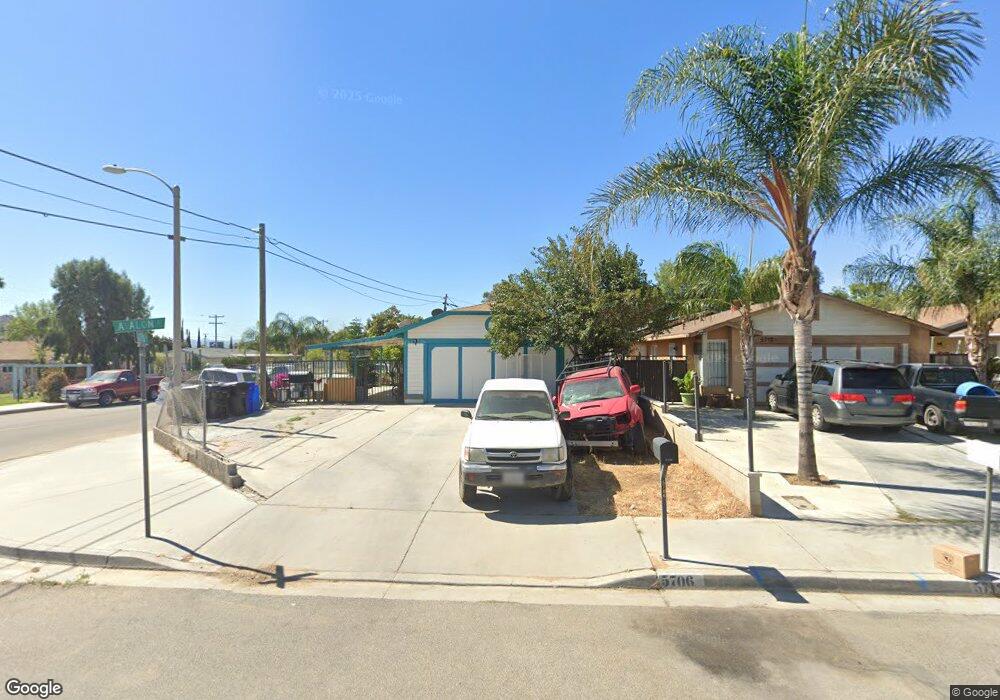
5706 Lotus St Riverside, CA 92509
Rubidoux NeighborhoodEstimated Value: $505,000 - $518,000
3
Beds
2
Baths
1,163
Sq Ft
$440/Sq Ft
Est. Value
About This Home
This home is located at 5706 Lotus St, Riverside, CA 92509 and is currently estimated at $511,973, approximately $440 per square foot. 5706 Lotus St is a home located in Riverside County with nearby schools including Rustic Lane Elementary School, Mission Middle School, and Rubidoux High School.
Ownership History
Date
Name
Owned For
Owner Type
Purchase Details
Closed on
Jun 7, 2025
Sold by
Nambo Bryan
Bought by
Nambo Family Trust and Nambo
Current Estimated Value
Purchase Details
Closed on
Jan 8, 2020
Sold by
Nambo Domingo and Nambo Paula
Bought by
Nambo Bryan
Purchase Details
Closed on
Jun 23, 2007
Sold by
Nambo Domingo C and Nambo Paula Estela
Bought by
Nambo Domingo and Nambo Paula
Purchase Details
Closed on
Jul 21, 1993
Sold by
Jara Salvador and Jara Andrea
Bought by
Nambo Domingo C and Nambo Paula Estela
Home Financials for this Owner
Home Financials are based on the most recent Mortgage that was taken out on this home.
Original Mortgage
$114,906
Interest Rate
7.13%
Mortgage Type
FHA
Create a Home Valuation Report for This Property
The Home Valuation Report is an in-depth analysis detailing your home's value as well as a comparison with similar homes in the area
Home Values in the Area
Average Home Value in this Area
Purchase History
We collect this data history from publicly available records. To have your information removed, we recommend requesting removal directly through your county’s website.
| Date | Buyer | Sale Price | Title Company |
|---|---|---|---|
| Nambo Family Trust | -- | None Listed On Document | |
| Nambo Bryan | -- | None Available | |
| Nambo Bryan | -- | None Available | |
| Nambo Domingo | -- | None Available | |
| Nambo Domingo C | -- | Fidelity National Title Ins | |
| Nambo Domingo C | -- | Fidelity National Title Ins |
Source: Public Records
Mortgage History
We collect this data history from publicly available records. To have your information removed, we recommend requesting removal directly through your county’s website.
| Date | Status | Borrower | Loan Amount |
|---|---|---|---|
| Previous Owner | Nambo Domingo C | $114,906 |
Source: Public Records
Tax History
| Year | Tax Paid | Tax Assessment Tax Assessment Total Assessment is a certain percentage of the fair market value that is determined by local assessors to be the total taxable value of land and additions on the property. | Land | Improvement |
|---|---|---|---|---|
| 2025 | $3,617 | $339,025 | $82,021 | $257,004 |
| 2023 | $3,617 | $325,862 | $78,837 | $247,025 |
| 2022 | $3,557 | $319,474 | $77,292 | $242,182 |
| 2021 | $3,532 | $313,211 | $75,777 | $237,434 |
| 2020 | $2,047 | $180,271 | $68,168 | $112,103 |
| 2019 | $2,007 | $176,737 | $66,832 | $109,905 |
| 2018 | $1,943 | $173,272 | $65,523 | $107,749 |
| 2017 | $1,923 | $169,876 | $64,239 | $105,637 |
| 2016 | $1,897 | $166,546 | $62,980 | $103,566 |
| 2015 | $1,872 | $164,046 | $62,035 | $102,011 |
| 2014 | $1,744 | $160,835 | $60,821 | $100,014 |
Source: Public Records
Map
Nearby Homes
- 7224 La Canada Dr
- 2990 Avalon St
- 14198 Serene Skies Ct
- 7261 La Canada Dr
- 7249 La Canada Dr
- 7237 La Canada Dr
- 7225 La Canada Dr
- 7262 Pine Crest St
- 7214 Pine Crest St
- 14156 Serene Skies Ct
- 14124 Serene Skies Ct
- 7240 Serene Skies Ct
- 7216 Serene Skies Ct
- 14190 Crystal Peak Ct
- 7536 La Canada Dr
- 14178 Crystal Peak Ct
- 7229 Serene Skies Ct
- 14165 Evergreen Ct
- 5510 28th St
- 14141 Evergreen Ct
Your Personal Tour Guide
Ask me questions while you tour the home.