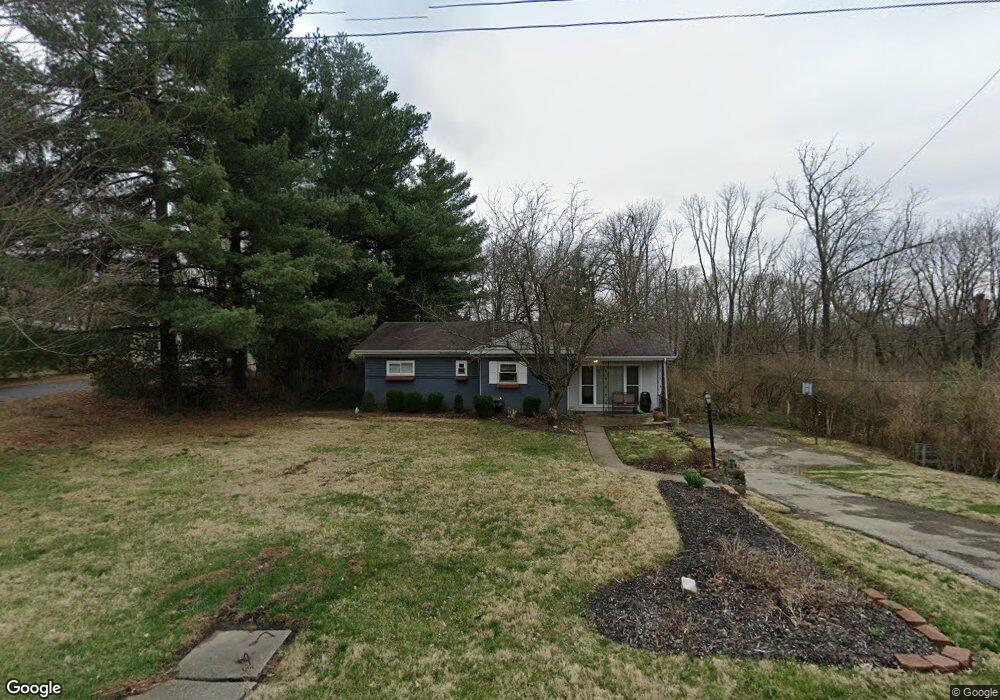
571 Fleming Rd Cincinnati, OH 45231
Estimated Value: $239,000 - $280,000
3
Beds
2
Baths
1,575
Sq Ft
$163/Sq Ft
Est. Value
About This Home
This home is located at 571 Fleming Rd, Cincinnati, OH 45231 and is currently estimated at $256,790, approximately $163 per square foot. 571 Fleming Rd is a home located in Hamilton County with nearby schools including John Paul II Catholic School.
Ownership History
Date
Name
Owned For
Owner Type
Purchase Details
Closed on
Mar 28, 1996
Sold by
Baumgardner Erich C and Baumgardner Ann W
Bought by
Sneed William Scott and Sneed Carol Jeanne
Current Estimated Value
Home Financials for this Owner
Home Financials are based on the most recent Mortgage that was taken out on this home.
Original Mortgage
$85,500
Outstanding Balance
$1,683
Interest Rate
6.98%
Estimated Equity
$255,107
Create a Home Valuation Report for This Property
The Home Valuation Report is an in-depth analysis detailing your home's value as well as a comparison with similar homes in the area
Home Values in the Area
Average Home Value in this Area
Purchase History
| Date | Buyer | Sale Price | Title Company |
|---|---|---|---|
| Sneed William Scott | $95,500 | -- |
Source: Public Records
Mortgage History
| Date | Status | Borrower | Loan Amount |
|---|---|---|---|
| Open | Sneed William Scott | $85,500 |
Source: Public Records
Tax History
| Year | Tax Paid | Tax Assessment Tax Assessment Total Assessment is a certain percentage of the fair market value that is determined by local assessors to be the total taxable value of land and additions on the property. | Land | Improvement |
|---|---|---|---|---|
| 2025 | $4,034 | $59,889 | $16,065 | $43,824 |
| 2024 | $3,929 | $59,889 | $16,065 | $43,824 |
| 2023 | $3,774 | $59,889 | $16,065 | $43,824 |
| 2022 | $3,709 | $44,097 | $15,166 | $28,931 |
| 2021 | $3,622 | $44,097 | $15,166 | $28,931 |
| 2020 | $3,674 | $44,097 | $15,166 | $28,931 |
| 2019 | $3,376 | $37,370 | $12,852 | $24,518 |
| 2018 | $3,384 | $37,370 | $12,852 | $24,518 |
| 2017 | $3,256 | $37,370 | $12,852 | $24,518 |
| 2016 | $3,060 | $34,423 | $12,982 | $21,441 |
| 2015 | $2,854 | $34,423 | $12,982 | $21,441 |
| 2014 | $2,844 | $34,423 | $12,982 | $21,441 |
| 2013 | $2,728 | $34,080 | $12,852 | $21,228 |
Source: Public Records
Map
Nearby Homes
- 416 Flemridge Ct
- 513 Chisholm Trail
- 9197 Long Ln
- 9319 Winton Rd
- 9315 Winton Rd
- 343 Ashley Ln
- 271 Poage Farm Rd
- 377 Compton Rd
- 9959 Mckelvey Rd
- 8768 Cavalier Dr
- 9305 Bridgecreek Dr Unit 14A
- 906 Garnoa Dr
- 9367 Stoneybrooke Unit 10G
- 204 Brocdorf Dr
- 269 Compton Rd
- 8990 Mockingbird Ln
- 155 Bonham Rd
- 320 Reily Rd
- 10133 Leacrest Rd
- 816 Sabino Ct
- 565 Fleming Rd
- 583 Fleming Rd
- 559 Fleming Rd
- 572 Fleming Rd
- 555 Fleming Rd
- 589 Fleming Rd
- 663 Hilltop Ln
- 564 Fleming Rd
- 613 Fleming Rd
- 668 Flagstaff Dr
- 552 Fleming Rd
- 545 Fleming Rd
- 594 Fleming Rd
- 597 Fleming Rd
- 662 Flagstaff Dr
- 657 Hilltop Ln
- 546 Fleming Rd
- 9448 Beech Dr
- 658 Flagstaff Dr
- 9431 Beech Dr
Your Personal Tour Guide
Ask me questions while you tour the home.