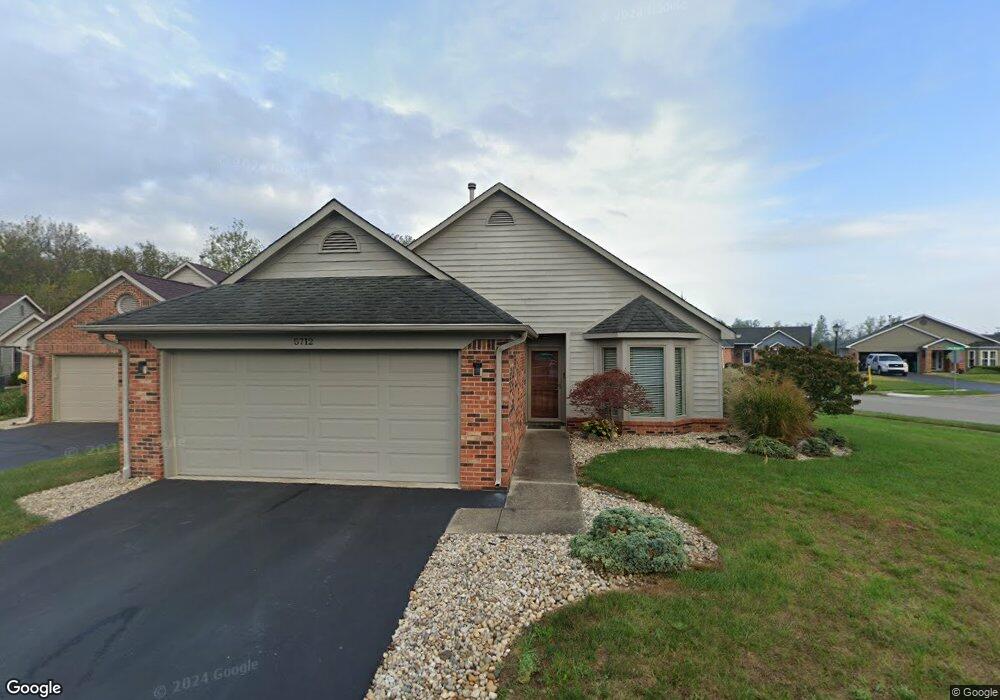
5712 Cross Bridge Ct Plainfield, IN 46168
Estimated Value: $261,000 - $274,000
3
Beds
2
Baths
1,230
Sq Ft
$217/Sq Ft
Est. Value
About This Home
This home is located at 5712 Cross Bridge Ct, Plainfield, IN 46168 and is currently estimated at $266,448, approximately $216 per square foot. 5712 Cross Bridge Ct is a home located in Hendricks County with nearby schools including Van Buren Elementary School, Plainfield Community Middle School, and Plainfield High School.
Ownership History
Date
Name
Owned For
Owner Type
Purchase Details
Closed on
Nov 1, 2018
Sold by
Farris Brad A
Bought by
Farris David L
Current Estimated Value
Purchase Details
Closed on
Nov 15, 2006
Sold by
Atwell Sharon
Bought by
Farris Brad A
Home Financials for this Owner
Home Financials are based on the most recent Mortgage that was taken out on this home.
Original Mortgage
$119,500
Outstanding Balance
$71,111
Interest Rate
6.41%
Mortgage Type
New Conventional
Estimated Equity
$195,337
Create a Home Valuation Report for This Property
The Home Valuation Report is an in-depth analysis detailing your home's value as well as a comparison with similar homes in the area
Home Values in the Area
Average Home Value in this Area
Purchase History
| Date | Buyer | Sale Price | Title Company |
|---|---|---|---|
| Farris David L | $116,696 | Abstract & Title | |
| Farris Brad A | -- | None Available |
Source: Public Records
Mortgage History
| Date | Status | Borrower | Loan Amount |
|---|---|---|---|
| Open | Farris Brad A | $119,500 |
Source: Public Records
Tax History Compared to Growth
Tax History
| Year | Tax Paid | Tax Assessment Tax Assessment Total Assessment is a certain percentage of the fair market value that is determined by local assessors to be the total taxable value of land and additions on the property. | Land | Improvement |
|---|---|---|---|---|
| 2024 | $1,134 | $210,700 | $57,900 | $152,800 |
| 2023 | $970 | $200,100 | $55,100 | $145,000 |
| 2022 | $1,059 | $191,000 | $52,500 | $138,500 |
| 2021 | $941 | $179,700 | $52,500 | $127,200 |
| 2020 | $734 | $163,100 | $37,800 | $125,300 |
| 2019 | $684 | $157,500 | $37,800 | $119,700 |
| 2018 | $600 | $154,000 | $37,800 | $116,200 |
| 2017 | $1,227 | $140,900 | $36,700 | $104,200 |
| 2016 | $1,168 | $136,800 | $36,700 | $100,100 |
| 2014 | $1,050 | $125,600 | $34,300 | $91,300 |
Source: Public Records
Map
Nearby Homes
- 5906 Juna Ave
- 5926 Juna Ave
- 5914 Juna Ave
- 1847 Crystal Bay Dr E
- 1836 Crystal Bay East Dr
- 5962 Oak Hill Dr W
- 6123 Haworth Cir
- 5879 Farwell Ave
- 4145 Los Gatos Ave
- 7624 Quail Ridge N
- 6890 Ben Riley Ct
- 7676 Amber Turn
- 0 S County Road 725 E
- ALWICK Plan at Trescott - Gardens
- PARKETTE Plan at Trescott - Gardens
- ALDEN Plan at Trescott - Gardens
- SHELBURN Plan at Trescott - Gardens
- MAJESTIC Plan at Trescott - Overlook
- MAJESTIC Plan at Trescott - Gardens
- BUCHANAN Plan at Trescott - Overlook
- 5716 Cross Bridge Ct
- 5716 Crossbridge Ct
- 824 Crossbridge Ct
- 5736 Cross Bridge Ct
- 5736 Crossbridge Ct
- 5732 Cross Bridge Ct
- 5719 Cross Bridge Way
- 5720 Cross Bridge Ct
- 5732 Crossbridge Ct
- 5708 Crystal Bay West Dr
- 5728 Cross Bridge Ct
- 5731 Cross Bridge Way
- 5724 Cross Bridge Ct
- 5711 Crystal Bay West Dr
- 5711 Crystal Bay Dr W
- 5717 Cross Bridge Way
- 5700 Crystal Bay Dr W
- 5740 Crystal Bay West Dr
- 5703 Crystal Bay West Dr
- 5700 Crystal Bay West Dr