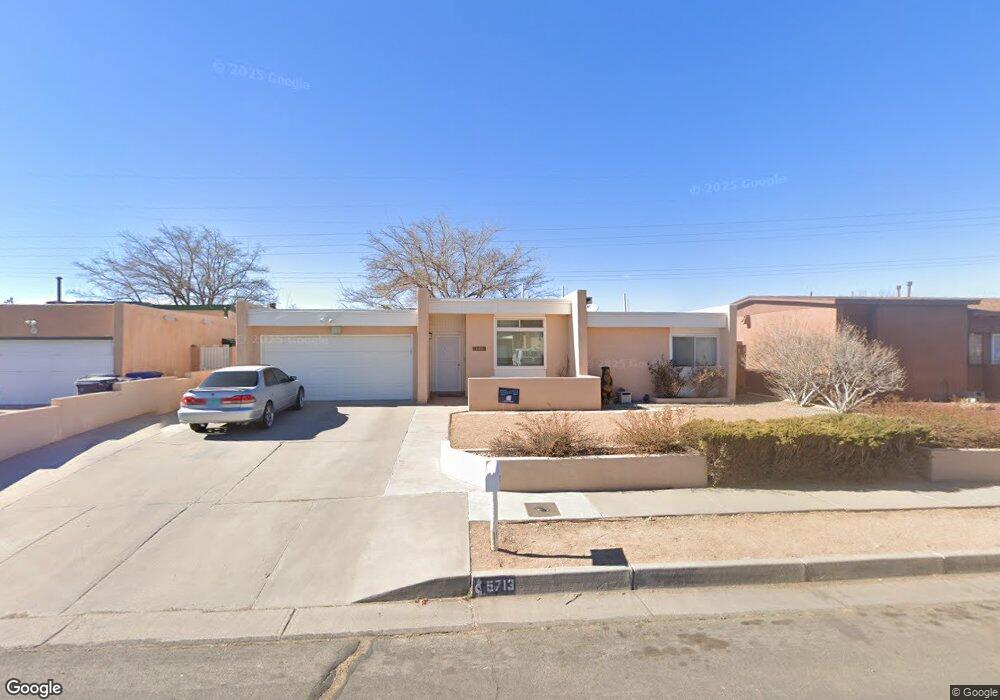
5713 Cambria Rd NW Albuquerque, NM 87120
Taylor Ranch NeighborhoodEstimated Value: $317,000 - $340,000
3
Beds
2
Baths
1,333
Sq Ft
$248/Sq Ft
Est. Value
About This Home
This home is located at 5713 Cambria Rd NW, Albuquerque, NM 87120 and is currently estimated at $330,016, approximately $247 per square foot. 5713 Cambria Rd NW is a home located in Bernalillo County with nearby schools including Marie M. Hughes Elementary School, L.B. Johnson Middle School, and Volcano Vista High School.
Ownership History
Date
Name
Owned For
Owner Type
Purchase Details
Closed on
Oct 20, 2010
Sold by
Pinkosky Langston Stacey A and Pinkosky Stacey A
Bought by
Hawkinson Mary
Current Estimated Value
Purchase Details
Closed on
Apr 27, 2007
Sold by
Weber Denis J
Bought by
Pinkosky Stacey A
Home Financials for this Owner
Home Financials are based on the most recent Mortgage that was taken out on this home.
Original Mortgage
$161,000
Interest Rate
6.1%
Mortgage Type
New Conventional
Purchase Details
Closed on
Dec 13, 2006
Sold by
Gold Richard L and Gold Maria Olga Jaquez
Bought by
Weber Denis J
Purchase Details
Closed on
Sep 7, 2006
Sold by
Abrego Zuly
Bought by
Dupre Robert W
Purchase Details
Closed on
Apr 18, 2003
Sold by
Williams Teresa Underwood and Underwood Teresa S
Bought by
Abrego Zuly
Home Financials for this Owner
Home Financials are based on the most recent Mortgage that was taken out on this home.
Original Mortgage
$87,900
Interest Rate
7.99%
Create a Home Valuation Report for This Property
The Home Valuation Report is an in-depth analysis detailing your home's value as well as a comparison with similar homes in the area
Home Values in the Area
Average Home Value in this Area
Purchase History
| Date | Buyer | Sale Price | Title Company |
|---|---|---|---|
| Hawkinson Mary | -- | Old Republic National Title | |
| Pinkosky Stacey A | -- | Fidelity National Title Co | |
| Weber Denis J | -- | None Available | |
| Dupre Robert W | -- | None Available | |
| Abrego Zuly | -- | Rio Grande Title Company Inc |
Source: Public Records
Mortgage History
| Date | Status | Borrower | Loan Amount |
|---|---|---|---|
| Previous Owner | Pinkosky Stacey A | $161,000 | |
| Previous Owner | Abrego Zuly | $87,900 | |
| Closed | Abrego Zuly | $22,000 |
Source: Public Records
Tax History Compared to Growth
Tax History
| Year | Tax Paid | Tax Assessment Tax Assessment Total Assessment is a certain percentage of the fair market value that is determined by local assessors to be the total taxable value of land and additions on the property. | Land | Improvement |
|---|---|---|---|---|
| 2025 | $2,244 | $56,830 | $14,425 | $42,405 |
| 2024 | $2,244 | $55,175 | $14,005 | $41,170 |
| 2023 | $2,204 | $53,569 | $13,598 | $39,971 |
| 2022 | $2,127 | $52,009 | $13,202 | $38,807 |
| 2021 | $2,053 | $50,494 | $12,817 | $37,677 |
| 2020 | $2,017 | $49,024 | $12,444 | $36,580 |
| 2019 | $1,955 | $47,596 | $12,082 | $35,514 |
| 2018 | $1,883 | $47,596 | $12,082 | $35,514 |
| 2017 | $1,823 | $46,210 | $11,730 | $34,480 |
| 2016 | $1,768 | $43,558 | $11,057 | $32,501 |
| 2015 | $42,290 | $42,290 | $10,735 | $31,555 |
| 2014 | $1,659 | $41,058 | $10,422 | $30,636 |
| 2013 | -- | $39,862 | $10,119 | $29,743 |
Source: Public Records
Map
Nearby Homes
- 5609 Cambria Rd NW
- 5432 Mariposa Dr NW
- 4911 Alberta Ln NW
- 4900 Alberta Ln NW
- 5305 Desert Sand Place NW
- 5239 La Colonia Dr NW
- 5504 Hayes Dr NW
- 6005 Rio Pueblo Dr NW
- 0 Canada Vista Place NW
- 5129 Camino Vista NW
- 5400 Pegasus Dr NW
- 6133 Flor de Mayo Place NW
- 5143 Gaviota NW
- 5805 Chimayo Dr NW
- 5901 Chimayo Dr NW
- 6101 Chimayo Dr NW
- 5101 Tecolote NW
- 5429 Gold Rush Dr NW
- 6212 Prairie Sage Dr NW
- 13 Tennis Ct NW
- 5717 Cambria Rd NW
- 5709 Cambria Rd NW
- 5801 Cambria Rd NW
- 5705 Cambria Rd NW
- 5708 Cambria Rd NW
- 5712 Cambria Rd NW
- 5716 Cambria Rd NW
- 5805 Cambria Rd NW
- 5800 Cambria Rd NW
- 5701 Cambria Rd NW
- 5704 Cambria Rd NW
- 5804 Cambria Rd NW
- 5700 Cambria Rd NW
- 5809 Cambria Rd NW
- 5221 College St NW
- 5617 Cambria Rd NW
- 5225 College St NW
- 5217 College St NW
- 5229 College St NW
- 5616 Cambria Rd NW