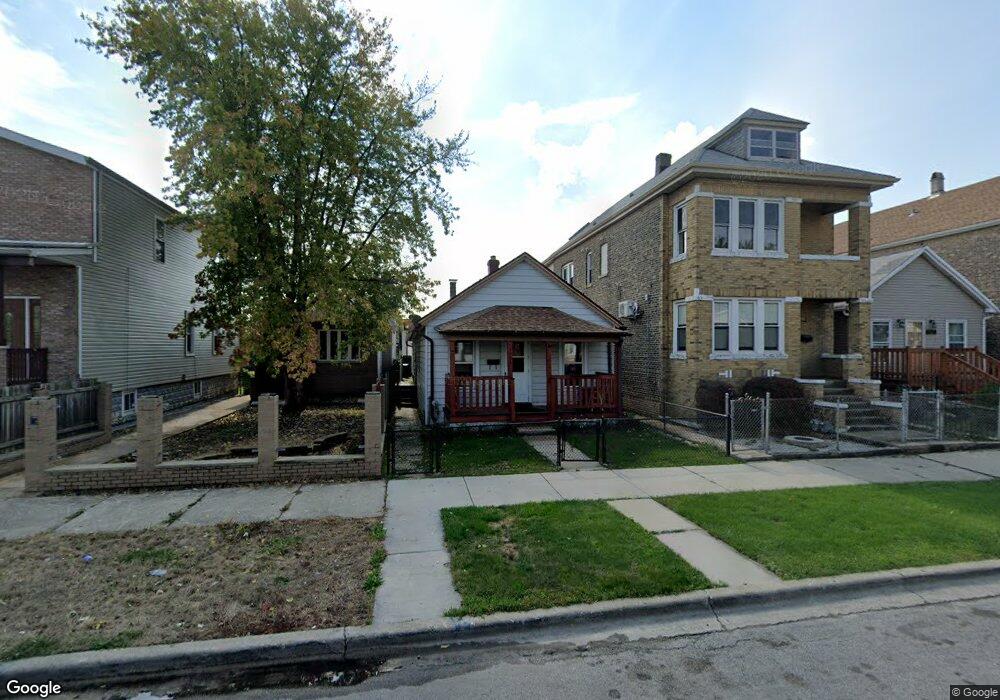
5715 W 64th Place Chicago, IL 60638
Clearing NeighborhoodEstimated Value: $285,742 - $383,000
2
Beds
1
Bath
900
Sq Ft
$380/Sq Ft
Est. Value
About This Home
This home is located at 5715 W 64th Place, Chicago, IL 60638 and is currently estimated at $341,686, approximately $379 per square foot. 5715 W 64th Place is a home located in Cook County with nearby schools including Hale Elementary School, Kennedy High School, and St. Symphorosa Catholic School.
Ownership History
Date
Name
Owned For
Owner Type
Purchase Details
Closed on
Sep 3, 2014
Sold by
Estrada Hector and Delgadillo Araceli
Bought by
Recendiz Adolfo and Acosta Maria G
Current Estimated Value
Home Financials for this Owner
Home Financials are based on the most recent Mortgage that was taken out on this home.
Original Mortgage
$40,000
Outstanding Balance
$33,166
Interest Rate
6.62%
Mortgage Type
New Conventional
Estimated Equity
$308,520
Purchase Details
Closed on
Jul 3, 2012
Sold by
Federal Home Loan Mortgage Corporation
Bought by
Estrada Hector and Delgadillo Araceli
Purchase Details
Closed on
Nov 7, 2011
Sold by
Rodriguez Maria R
Bought by
Federal Home Loan Mortgage Corporation
Purchase Details
Closed on
Sep 28, 2006
Sold by
Shive Cathleen E
Bought by
Rodriguez Maria R
Purchase Details
Closed on
Aug 6, 2004
Sold by
Shive Ira L
Bought by
Shive Cathleen E
Create a Home Valuation Report for This Property
The Home Valuation Report is an in-depth analysis detailing your home's value as well as a comparison with similar homes in the area
Home Values in the Area
Average Home Value in this Area
Purchase History
| Date | Buyer | Sale Price | Title Company |
|---|---|---|---|
| Recendiz Adolfo | $102,000 | None Available | |
| Estrada Hector | $126,000 | Atgf Inc | |
| Federal Home Loan Mortgage Corporation | -- | None Available | |
| Rodriguez Maria R | $157,000 | Pntn | |
| Shive Cathleen E | -- | -- |
Source: Public Records
Mortgage History
| Date | Status | Borrower | Loan Amount |
|---|---|---|---|
| Open | Recendiz Adolfo | $40,000 |
Source: Public Records
Tax History Compared to Growth
Tax History
| Year | Tax Paid | Tax Assessment Tax Assessment Total Assessment is a certain percentage of the fair market value that is determined by local assessors to be the total taxable value of land and additions on the property. | Land | Improvement |
|---|---|---|---|---|
| 2024 | $1,630 | $23,000 | $4,375 | $18,625 |
| 2023 | $1,568 | $11,000 | $3,906 | $7,094 |
| 2022 | $1,568 | $11,000 | $3,906 | $7,094 |
| 2021 | $1,542 | $10,999 | $3,906 | $7,093 |
| 2020 | $2,761 | $15,415 | $3,125 | $12,290 |
| 2019 | $2,770 | $17,128 | $3,125 | $14,003 |
| 2018 | $3,405 | $17,128 | $3,125 | $14,003 |
| 2017 | $2,372 | $10,948 | $2,812 | $8,136 |
| 2016 | $2,207 | $10,948 | $2,812 | $8,136 |
| 2015 | $2,021 | $10,948 | $2,812 | $8,136 |
| 2014 | $1,707 | $11,699 | $2,656 | $9,043 |
| 2013 | $1,663 | $11,699 | $2,656 | $9,043 |
Source: Public Records
Map
Nearby Homes
- 5749 W 64th Place
- 5631 W 64th Place
- 5817 W 64th St
- 5533 W 63rd Place
- 6129 S Parkside Ave
- 6058 S Massasoit Ave
- 6054 W 64th St
- 6403 S Lorel Ave
- 6152 S Austin Ave
- 6025 S Major Ave
- 6005 S Menard Ave
- 6037 S Mason Ave
- 6135 W 63rd Place
- 6016 S Mayfield Ave
- 6152 W 64th Place
- 6123 S Meade Ave
- 6155 S Moody Ave
- 6230 W 63rd Place
- 6046 S Melvina Ave
- 5814 S Massasoit Ave
- 5715 W 64th Place
- 5719 W 64th Place
- 5719 W 64th Place
- 5711 W 64th Place
- 5713 W 64th Place
- 5721 W 64th Place
- 5709 W 64th Place
- 5709 W 64th Place
- 5709 W 64th Place Unit 2
- 5723 W 64th Place
- 5723 W 64th Place
- 5707 W 64th Place
- 5727 W 64th Place
- 5727 W 64th Place
- 5703 W 64th Place
- 5703 W 64th Place
- 5729 W 64th Place
- 5712 W 65th St
- 5731 W 64th Place
- 5731 W 64th Place