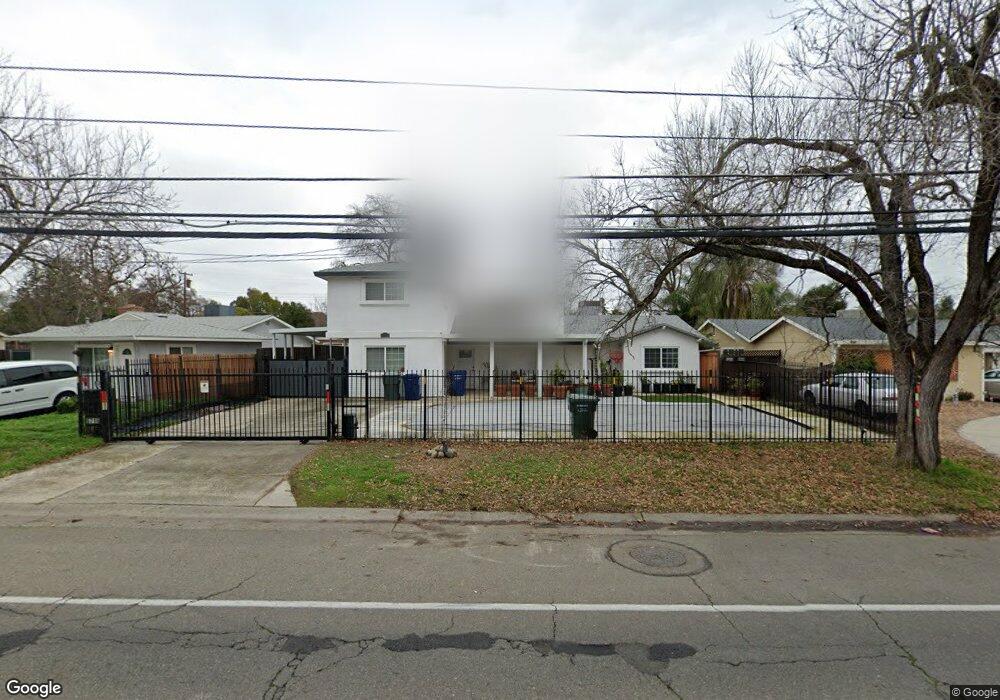
5716 Dewey Dr Fair Oaks, CA 95628
Lincoln Oaks NeighborhoodEstimated Value: $468,000 - $674,000
5
Beds
2
Baths
2,169
Sq Ft
$280/Sq Ft
Est. Value
About This Home
This home is located at 5716 Dewey Dr, Fair Oaks, CA 95628 and is currently estimated at $606,602, approximately $279 per square foot. 5716 Dewey Dr is a home located in Sacramento County with nearby schools including Charles Peck Elementary School, Will Rogers Middle School, and San Juan High School.
Ownership History
Date
Name
Owned For
Owner Type
Purchase Details
Closed on
Sep 19, 2014
Sold by
Leong Richard K
Bought by
Lim Rachel A
Current Estimated Value
Purchase Details
Closed on
Jun 27, 2005
Sold by
Stuhr David Wayne and Stuhr Laura Aleta
Bought by
Leong Richard K and Lim Rachel Ada
Home Financials for this Owner
Home Financials are based on the most recent Mortgage that was taken out on this home.
Original Mortgage
$368,000
Interest Rate
5.62%
Mortgage Type
New Conventional
Purchase Details
Closed on
Jan 21, 2000
Sold by
Healy Patti J and Healy John L
Bought by
Healy Patti J and Ozenick Phillip M
Purchase Details
Closed on
Jun 30, 1999
Sold by
Long Eric A and The Eric A Long Revocable Trus
Bought by
Stuhr David Wayne and Stuhr Laura Aleta
Purchase Details
Closed on
Feb 26, 1999
Sold by
Mockler Donald T and Mockler Shirley M
Bought by
Long Eric A and The Eric A Long Revocable Trus
Create a Home Valuation Report for This Property
The Home Valuation Report is an in-depth analysis detailing your home's value as well as a comparison with similar homes in the area
Home Values in the Area
Average Home Value in this Area
Purchase History
| Date | Buyer | Sale Price | Title Company |
|---|---|---|---|
| Lim Rachel A | -- | None Available | |
| Leong Richard K | $460,000 | Financial Title Company | |
| Healy Patti J | -- | -- | |
| Stuhr David Wayne | $146,000 | Stewart Title | |
| Long Eric A | $105,000 | Stewart Title |
Source: Public Records
Mortgage History
| Date | Status | Borrower | Loan Amount |
|---|---|---|---|
| Previous Owner | Leong Richard K | $368,000 |
Source: Public Records
Tax History Compared to Growth
Tax History
| Year | Tax Paid | Tax Assessment Tax Assessment Total Assessment is a certain percentage of the fair market value that is determined by local assessors to be the total taxable value of land and additions on the property. | Land | Improvement |
|---|---|---|---|---|
| 2025 | $5,923 | $509,597 | $121,046 | $388,551 |
| 2024 | $5,923 | $499,606 | $118,673 | $380,933 |
| 2023 | $5,770 | $489,811 | $116,347 | $373,464 |
| 2022 | $5,739 | $480,208 | $114,066 | $366,142 |
| 2021 | $5,642 | $470,793 | $111,830 | $358,963 |
| 2020 | $5,536 | $465,967 | $110,684 | $355,283 |
| 2019 | $5,423 | $456,831 | $108,514 | $348,317 |
| 2018 | $5,098 | $426,360 | $98,061 | $328,299 |
| 2017 | $4,631 | $384,109 | $88,344 | $295,765 |
| 2016 | $3,968 | $346,045 | $79,590 | $266,455 |
| 2015 | $3,661 | $320,413 | $73,695 | $246,718 |
| 2014 | $3,509 | $300,784 | $78,465 | $222,319 |
Source: Public Records
Map
Nearby Homes
- 6757 Judistine Dr
- 6801 Dunmore Ave
- 6945 Amberwick Way
- 5610 Millburn St
- 6820 Brooknoll Ct
- 5710 Parkoaks Dr
- 5978 Brooktree Dr
- 6363 Aslin Way
- 6856 Woodlock Way
- 6705 Palmtree Ct
- 5329 Aldorae St
- 6309 Parkcreek Cir
- 5330 Sable Wood Ln
- 6693 Greenback Ln
- 5332 Sandstone St
- 6665 Greenback Ln
- 6071 Peoria Dr
- 6537 Greenback Ln Unit 2
- 5755 Hesper Way
- 5437 Elsinore Way
- 5720 Dewey Dr
- 5712 Dewey Dr
- 0 Dewey Dr
- 5724 Dewey Dr
- 5708 Dewey Dr
- 6713 Judistine Dr
- 6717 Judistine Dr
- 6709 Judistine Dr
- 5728 Dewey Dr
- 6709 Linda Sue Way
- 6701 Linda Sue Way
- 5719 Dewey Dr
- 5713 Dewey Dr
- 6721 Judistine Dr
- 6713 Linda Sue Way
- 5723 Dewey Dr
- 5707 Dewey Dr
- 6705 Judistine Dr
- 5729 Dewey Dr
- 6725 Judistine Dr