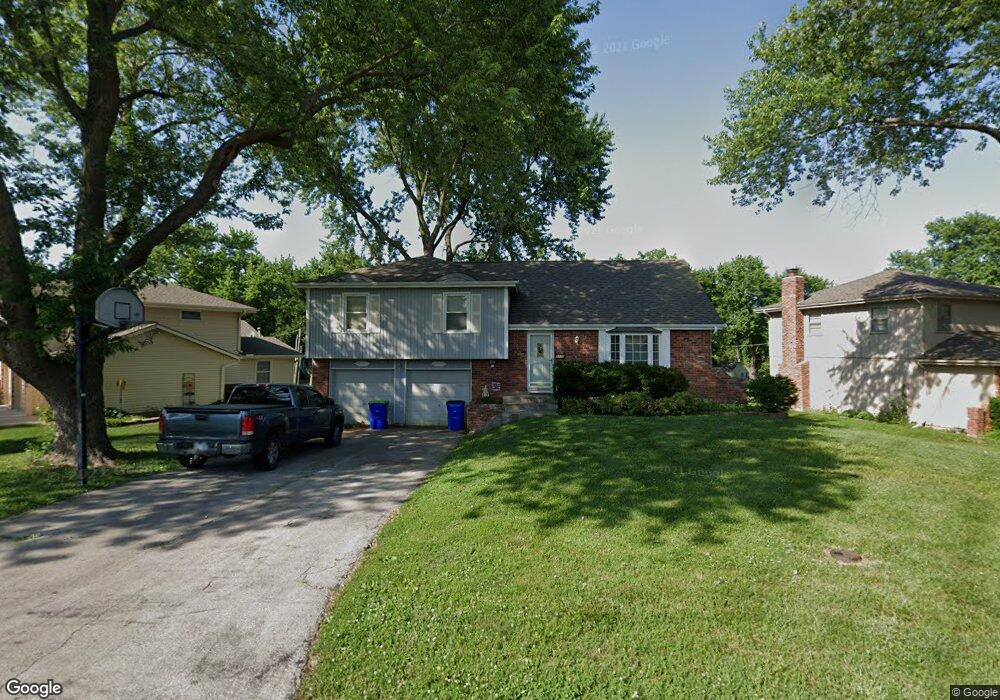
5719 Earnshaw St Shawnee, KS 66216
Estimated Value: $335,000 - $361,000
4
Beds
2
Baths
1,608
Sq Ft
$214/Sq Ft
Est. Value
About This Home
This home is located at 5719 Earnshaw St, Shawnee, KS 66216 and is currently estimated at $344,244, approximately $214 per square foot. 5719 Earnshaw St is a home located in Johnson County with nearby schools including Ray Marsh Elementary School, Trailridge Middle School, and Shawnee Mission Northwest High School.
Ownership History
Date
Name
Owned For
Owner Type
Purchase Details
Closed on
Oct 5, 2023
Sold by
Higgins Jeanne E
Bought by
Jeanne E Higgins Revocable Trust and Higgins
Current Estimated Value
Purchase Details
Closed on
Nov 1, 2005
Sold by
Marlin Gary J and Marlin Julie A
Bought by
Keeler Terri M
Home Financials for this Owner
Home Financials are based on the most recent Mortgage that was taken out on this home.
Original Mortgage
$144,000
Interest Rate
6.37%
Mortgage Type
New Conventional
Purchase Details
Closed on
Nov 26, 2002
Sold by
Marlin Gary J and Marlin Julie A
Bought by
Marlin Gary J and Marlin Julie A
Home Financials for this Owner
Home Financials are based on the most recent Mortgage that was taken out on this home.
Original Mortgage
$38,300
Interest Rate
6.13%
Mortgage Type
Stand Alone Second
Create a Home Valuation Report for This Property
The Home Valuation Report is an in-depth analysis detailing your home's value as well as a comparison with similar homes in the area
Home Values in the Area
Average Home Value in this Area
Purchase History
| Date | Buyer | Sale Price | Title Company |
|---|---|---|---|
| Jeanne E Higgins Revocable Trust | -- | None Listed On Document | |
| Keeler Terri M | -- | None Available | |
| Marlin Gary J | -- | Kansas Title Ins Corp |
Source: Public Records
Mortgage History
| Date | Status | Borrower | Loan Amount |
|---|---|---|---|
| Previous Owner | Keeler Terri M | $144,000 | |
| Previous Owner | Marlin Gary J | $38,300 |
Source: Public Records
Tax History Compared to Growth
Tax History
| Year | Tax Paid | Tax Assessment Tax Assessment Total Assessment is a certain percentage of the fair market value that is determined by local assessors to be the total taxable value of land and additions on the property. | Land | Improvement |
|---|---|---|---|---|
| 2024 | $3,665 | $34,754 | $5,555 | $29,199 |
| 2023 | $3,601 | $33,615 | $5,555 | $28,060 |
| 2022 | $3,356 | $31,211 | $5,175 | $26,036 |
| 2021 | $3,134 | $27,301 | $4,499 | $22,802 |
| 2020 | $2,971 | $25,530 | $4,081 | $21,449 |
| 2019 | $2,774 | $23,817 | $3,065 | $20,752 |
| 2018 | $2,654 | $22,689 | $2,747 | $19,942 |
| 2017 | $2,690 | $22,643 | $2,747 | $19,896 |
| 2016 | $2,433 | $20,205 | $2,747 | $17,458 |
| 2015 | $2,325 | $20,102 | $2,747 | $17,355 |
| 2013 | -- | $18,894 | $2,747 | $16,147 |
Source: Public Records
Map
Nearby Homes
- 5845 Caenen St
- 12508 W 56th St
- 5504 Monrovia St
- 5407 Halsey St
- 11815 W 53rd St
- 12809 W 57th Terrace
- 13126 W 52nd Terrace
- 13134 W 52nd Terrace
- 13130 W 52nd Terrace
- 5807 Noland Rd
- 11002 W 55th Terrace
- 5308 Mcanany Dr
- 12116 W 63rd Terrace
- 11403 W 51st Terrace
- 4908 Noland Rd
- 5507 Noland Rd
- Ashwood Plan at Bristol Highlands - North
- The Fleetwood Plan at Bristol Highlands - The Villas
- Cypress II Plan at Bristol Highlands - North
- The Fleetwood Plan at Bristol Highlands - The Manors
- 11916 W 57th Terrace
- 5717 Earnshaw St
- 5713 Earnshaw St
- 11910 W 57th Terrace
- 5720 Earnshaw St
- 11915 W 57th St
- 11921 W 57th Terrace
- 5710 Quivira Rd
- 11919 W 57th St
- 5720 Quivira Rd
- 11927 W 57th St
- 5716 Earnshaw St
- 5712 Earnshaw St
- 5706 Quivira Rd
- 11909 W 57th St
- 11909 W 57th Terrace
- 5708 Earnshaw St
- 5724 Earnshaw St
- 5723 Earnshaw St
- 11903 W 57th St