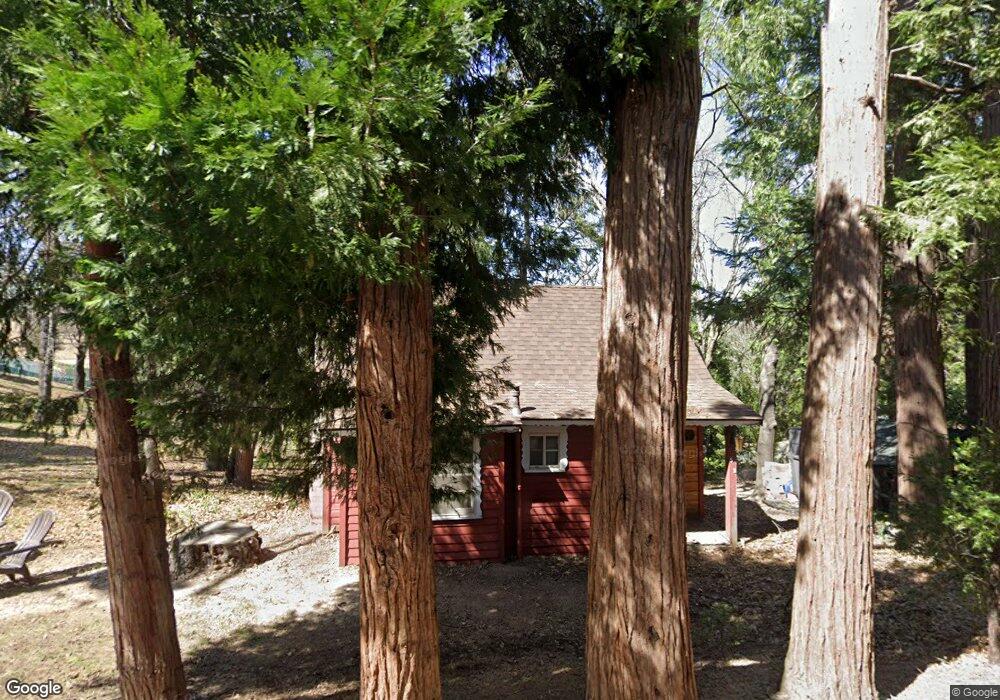
572 Ashlar Dr Crestline, CA 92325
Estimated Value: $184,000 - $285,000
2
Beds
1
Bath
643
Sq Ft
$352/Sq Ft
Est. Value
About This Home
This home is located at 572 Ashlar Dr, Crestline, CA 92325 and is currently estimated at $226,163, approximately $351 per square foot. 572 Ashlar Dr is a home with nearby schools including Valley Of Enchantment Elementary School, Mary P. Henck Intermediate School, and Rim Of The World Senior High School.
Ownership History
Date
Name
Owned For
Owner Type
Purchase Details
Closed on
Nov 5, 2021
Sold by
Millone Susan K
Bought by
Millone John and Millone Susan
Current Estimated Value
Purchase Details
Closed on
Jul 12, 2021
Sold by
Prendergast Maureen
Bought by
Prendergast Daniel F and Prendergast Maureen
Purchase Details
Closed on
Dec 2, 2011
Sold by
Quirk Steven
Bought by
Millone Susan K and Prendergast Maureen
Purchase Details
Closed on
Nov 29, 2011
Sold by
Millone John
Bought by
Millone Susan K
Purchase Details
Closed on
Mar 5, 2009
Sold by
Carr Jeri Lynne Quirk
Bought by
Millone Susan K and Quirk Steven J
Purchase Details
Closed on
Jun 27, 1997
Sold by
Quirk Jerome J
Bought by
Quirk Jerome J
Create a Home Valuation Report for This Property
The Home Valuation Report is an in-depth analysis detailing your home's value as well as a comparison with similar homes in the area
Home Values in the Area
Average Home Value in this Area
Purchase History
| Date | Buyer | Sale Price | Title Company |
|---|---|---|---|
| Millone John | -- | None Available | |
| Prendergast Daniel F | -- | None Available | |
| Millone Susan K | $9,000 | First American Title Company | |
| Millone Susan K | -- | First American Title Company | |
| Prendergast Maureen | -- | First American Title Company | |
| Quirk Richard A | -- | First American Title Company | |
| Quirk Carr Jeri Lynne | -- | First American Title Company | |
| Millone Susan K | -- | None Available | |
| Quirk Jerome J | -- | -- |
Source: Public Records
Tax History
| Year | Tax Paid | Tax Assessment Tax Assessment Total Assessment is a certain percentage of the fair market value that is determined by local assessors to be the total taxable value of land and additions on the property. | Land | Improvement |
|---|---|---|---|---|
| 2025 | $911 | $37,055 | $3,526 | $33,529 |
| 2024 | $887 | $36,329 | $3,457 | $32,872 |
| 2023 | $873 | $35,616 | $3,389 | $32,227 |
| 2022 | $841 | $34,918 | $3,323 | $31,595 |
| 2021 | $1,192 | $34,233 | $3,258 | $30,975 |
| 2020 | $1,174 | $33,882 | $3,225 | $30,657 |
| 2019 | $1,177 | $33,218 | $3,162 | $30,056 |
| 2018 | $803 | $32,567 | $3,100 | $29,467 |
| 2017 | $549 | $31,928 | $3,039 | $28,889 |
| 2016 | $537 | $31,302 | $2,979 | $28,323 |
| 2015 | $534 | $30,832 | $2,934 | $27,898 |
| 2014 | $527 | $30,229 | $2,877 | $27,352 |
Source: Public Records
Map
Nearby Homes
- 0 Acacia Unit HD25238555
- 0 Acacia Unit HD25162627
- 519 S Dart Canyon Rd
- 508 S Dart Canyon Rd
- 583 Arbula Dr
- 503 Valley Dr
- 0 Ashlar Dr Unit CV26042276
- 0 Ashlar Dr Unit JT26026119
- 489 Dorn Dr
- 688 Arth Dr
- 3 Arth Dr
- 710 Arbula Dr
- 746 Arth Dr
- 724 Arosa Dr
- 660 Acacia Dr
- 00 Dorn Dr
- 25035 Moon Dr
- 455 Delle Dr
- 25126 Jewel Dr
- 398 Dunant Dr
- 570 Ashlar Dr
- 580 Ashlar Dr
- 547 Acacia Dr
- 27 Acacia
- 571 Ashlar Dr
- 525 Acacia Dr
- 539 Acacia Dr
- 530 Acacia Dr
- 588 Ashlar Dr
- 528 Acacia Dr
- 528 Acacia Dr
- 528 Acacia Ct
- 625 Arosa Dr
- 625 Arosa Dr Unit 1
- 667 Pyramid Dr
- 553 Acacia Dr
- 556 Acacia Dr
- 0 Acacia Dr and Pyramid Dr Unit SR17096433
- 0 Acacia Unit EV18092821
- 0 Acacia Unit 10-464255
Your Personal Tour Guide
Ask me questions while you tour the home.