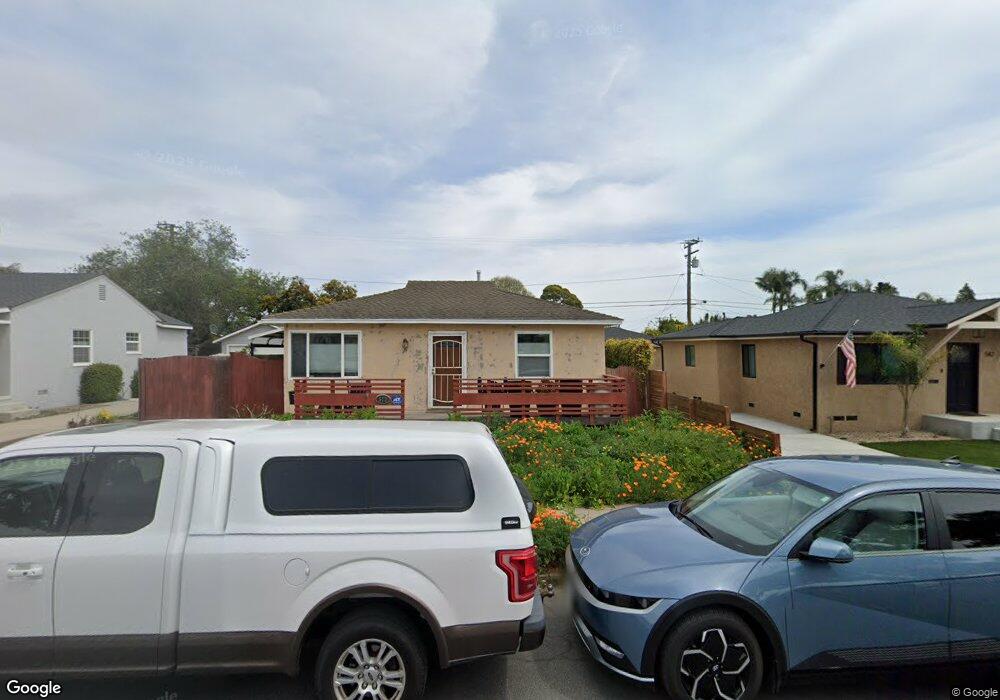
572 Jones St Ventura, CA 93003
Midtown NeighborhoodEstimated Value: $785,000 - $955,000
2
Beds
2
Baths
1,182
Sq Ft
$723/Sq Ft
Est. Value
About This Home
This home is located at 572 Jones St, Ventura, CA 93003 and is currently estimated at $854,813, approximately $723 per square foot. 572 Jones St is a home located in Ventura County with nearby schools including Will Rogers Elementary School, Cabrillo Middle School, and Ventura High School.
Ownership History
Date
Name
Owned For
Owner Type
Purchase Details
Closed on
May 24, 2016
Sold by
Callahan Daniel Joseph and Callahan Rhonda Laine Short
Bought by
The Daniel & Rhonda Callahan 2016 Trust and Callahan Rhonda Laine
Current Estimated Value
Purchase Details
Closed on
Jun 7, 2007
Sold by
Callahan Daniel
Bought by
Callahan Daniel Joseph and Callahan Rhonda Laine Short
Purchase Details
Closed on
Oct 17, 1996
Sold by
Morin Frank E
Bought by
Callahan Daniel
Home Financials for this Owner
Home Financials are based on the most recent Mortgage that was taken out on this home.
Original Mortgage
$122,800
Outstanding Balance
$11,295
Interest Rate
8.11%
Estimated Equity
$843,518
Purchase Details
Closed on
Mar 25, 1994
Sold by
Morin Sharon R
Bought by
Morin Frank E
Home Financials for this Owner
Home Financials are based on the most recent Mortgage that was taken out on this home.
Original Mortgage
$144,000
Interest Rate
4.75%
Create a Home Valuation Report for This Property
The Home Valuation Report is an in-depth analysis detailing your home's value as well as a comparison with similar homes in the area
Home Values in the Area
Average Home Value in this Area
Purchase History
| Date | Buyer | Sale Price | Title Company |
|---|---|---|---|
| The Daniel & Rhonda Callahan 2016 Trust | -- | None Available | |
| Callahan Daniel Joseph | -- | None Available | |
| Callahan Daniel Joseph | -- | None Available | |
| Callahan Daniel | $153,500 | First American Title Ins Co | |
| Morin Frank E | -- | Continental Lawyers Title |
Source: Public Records
Mortgage History
| Date | Status | Borrower | Loan Amount |
|---|---|---|---|
| Open | Callahan Daniel | $122,800 | |
| Previous Owner | Morin Frank E | $144,000 | |
| Closed | Callahan Daniel | $15,350 |
Source: Public Records
Tax History Compared to Growth
Tax History
| Year | Tax Paid | Tax Assessment Tax Assessment Total Assessment is a certain percentage of the fair market value that is determined by local assessors to be the total taxable value of land and additions on the property. | Land | Improvement |
|---|---|---|---|---|
| 2025 | $3,076 | $284,679 | $162,857 | $121,822 |
| 2024 | $3,076 | $279,098 | $159,664 | $119,434 |
| 2023 | $3,038 | $273,626 | $156,533 | $117,093 |
| 2022 | $2,832 | $268,261 | $153,463 | $114,798 |
| 2021 | $2,777 | $263,001 | $150,453 | $112,548 |
| 2020 | $2,751 | $260,306 | $148,911 | $111,395 |
| 2019 | $2,700 | $255,203 | $145,992 | $109,211 |
| 2018 | $2,654 | $250,200 | $143,130 | $107,070 |
| 2017 | $2,598 | $245,295 | $140,324 | $104,971 |
| 2016 | $2,547 | $240,486 | $137,573 | $102,913 |
| 2015 | $2,520 | $236,875 | $135,507 | $101,368 |
| 2014 | $2,478 | $232,236 | $132,853 | $99,383 |
Source: Public Records
Map
Nearby Homes
- 476 Howard St
- 431 Eva St
- 2378 Channel Dr Unit 105
- 2378 Channel Dr Unit 103
- 2392 Haley Point Dr Unit 104
- 2392 Haley Point Dr Unit 103
- 2380 Haley Point Dr Unit 104
- 2380 Haley Point Dr Unit 101
- 561 S Brent St
- 297 Rancho Dr
- 2338 Haley Point Dr Unit 105
- 2338 Haley Point Dr Unit 102
- 401 S Brent St
- 2364 Haley Point Dr Unit 103
- 2364 Haley Point Dr Unit 101
- 2352 Channel Dr Unit 104
- 2352 Channel Dr Unit 101
- 2352 Channel Dr Unit 105
- 344 S Evergreen Dr
- 0 Alessandro Dr Unit V1-27834