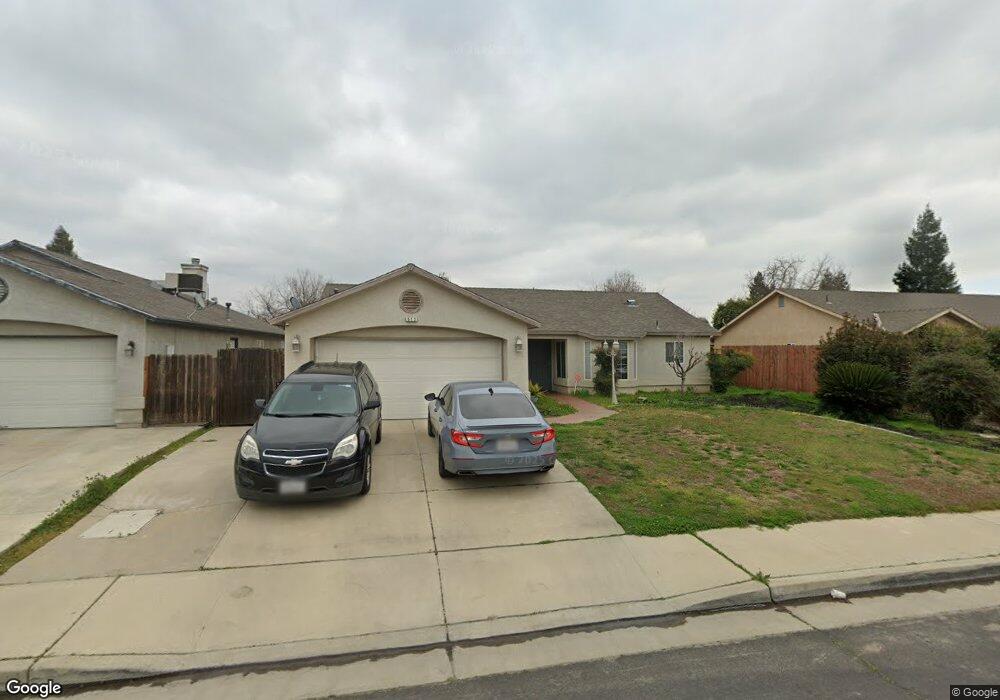
572 Morton Ave Sanger, CA 93657
Estimated Value: $295,000 - $368,000
4
Beds
2
Baths
1,320
Sq Ft
$254/Sq Ft
Est. Value
About This Home
This home is located at 572 Morton Ave, Sanger, CA 93657 and is currently estimated at $335,475, approximately $254 per square foot. 572 Morton Ave is a home located in Fresno County with nearby schools including Wilson Elementary School, Washington Academic Middle School, and Sanger High School.
Ownership History
Date
Name
Owned For
Owner Type
Purchase Details
Closed on
Jul 1, 2002
Sold by
Mj Construction Co
Bought by
Mendoza Ruben G
Current Estimated Value
Home Financials for this Owner
Home Financials are based on the most recent Mortgage that was taken out on this home.
Original Mortgage
$100,789
Interest Rate
6.09%
Mortgage Type
FHA
Create a Home Valuation Report for This Property
The Home Valuation Report is an in-depth analysis detailing your home's value as well as a comparison with similar homes in the area
Home Values in the Area
Average Home Value in this Area
Purchase History
| Date | Buyer | Sale Price | Title Company |
|---|---|---|---|
| Mendoza Ruben G | $102,500 | Financial Title Company |
Source: Public Records
Mortgage History
| Date | Status | Borrower | Loan Amount |
|---|---|---|---|
| Previous Owner | Mendoza Ruben G | $100,789 | |
| Closed | Mendoza Ruben G | $3,072 |
Source: Public Records
Tax History Compared to Growth
Tax History
| Year | Tax Paid | Tax Assessment Tax Assessment Total Assessment is a certain percentage of the fair market value that is determined by local assessors to be the total taxable value of land and additions on the property. | Land | Improvement |
|---|---|---|---|---|
| 2025 | $1,737 | $150,419 | $36,196 | $114,223 |
| 2023 | $1,714 | $144,581 | $34,792 | $109,789 |
| 2022 | $1,686 | $141,747 | $34,110 | $107,637 |
| 2021 | $1,671 | $138,969 | $33,442 | $105,527 |
| 2020 | $1,622 | $137,545 | $33,100 | $104,445 |
| 2019 | $1,588 | $134,849 | $32,451 | $102,398 |
| 2018 | $1,521 | $132,206 | $31,815 | $100,391 |
| 2017 | $1,493 | $129,615 | $31,192 | $98,423 |
| 2016 | $1,403 | $127,075 | $30,581 | $96,494 |
| 2015 | $1,413 | $125,167 | $30,122 | $95,045 |
| 2014 | $1,392 | $122,716 | $29,532 | $93,184 |
Source: Public Records
Map
Nearby Homes