Estimated Value: $238,000 - $385,000
3
Beds
2
Baths
1,750
Sq Ft
$164/Sq Ft
Est. Value
About This Home
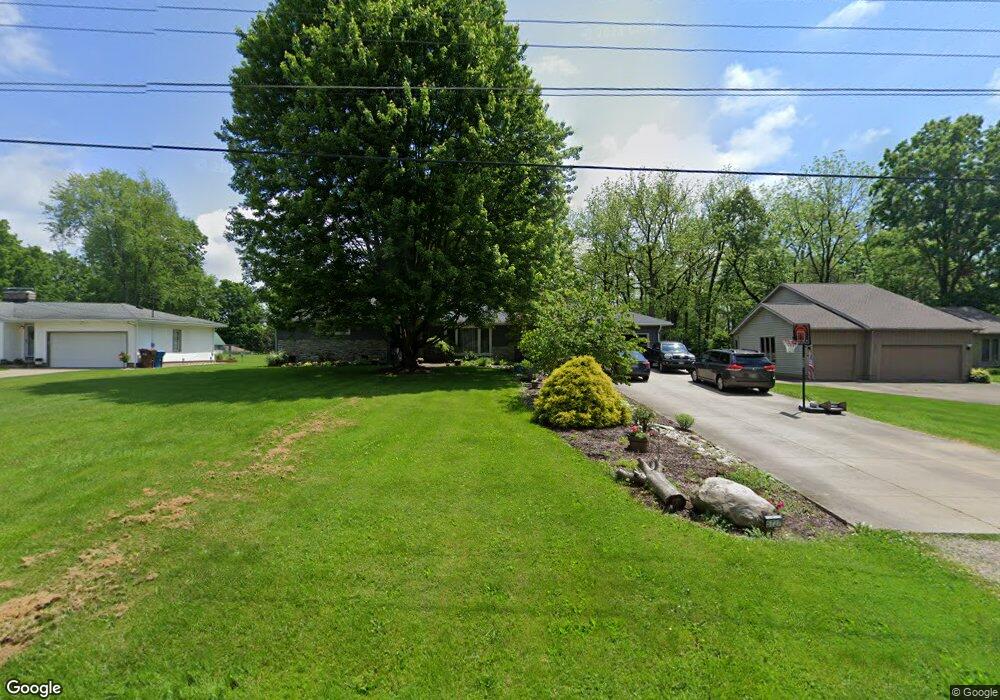
This home is located at 5727 Towerview Dr, Akron, OH 44319 and is currently estimated at $286,788, approximately $163 per square foot. 5727 Towerview Dr is a home located in Summit County with nearby schools including St. Francis de Sales School.
Ownership History
Date
Name
Owned For
Owner Type
Purchase Details
Closed on
Apr 28, 2011
Sold by
Sprague William G and Sprague Kimberly J
Bought by
Miller Brian G and Miller Elena K
Current Estimated Value
Home Financials for this Owner
Home Financials are based on the most recent Mortgage that was taken out on this home.
Original Mortgage
$153,000
Outstanding Balance
$105,788
Interest Rate
4.77%
Mortgage Type
New Conventional
Estimated Equity
$181,000
Purchase Details
Closed on
Sep 20, 2000
Sold by
Barringer Clyde R
Bought by
Sprague William G and Sprague Kimberly J
Home Financials for this Owner
Home Financials are based on the most recent Mortgage that was taken out on this home.
Original Mortgage
$89,600
Interest Rate
8.05%
Create a Home Valuation Report for This Property
The Home Valuation Report is an in-depth analysis detailing your home's value as well as a comparison with similar homes in the area
Home Values in the Area
Average Home Value in this Area
Purchase History
| Date | Buyer | Sale Price | Title Company |
|---|---|---|---|
| Miller Brian G | $168,000 | Village Title | |
| Sprague William G | $112,000 | Approved Statewide Title Age |
Source: Public Records
Mortgage History
| Date | Status | Borrower | Loan Amount |
|---|---|---|---|
| Open | Miller Brian G | $153,000 | |
| Closed | Sprague William G | $89,600 |
Source: Public Records
Tax History Compared to Growth
Tax History
| Year | Tax Paid | Tax Assessment Tax Assessment Total Assessment is a certain percentage of the fair market value that is determined by local assessors to be the total taxable value of land and additions on the property. | Land | Improvement |
|---|---|---|---|---|
| 2025 | $3,539 | $70,917 | $11,809 | $59,108 |
| 2024 | $3,539 | $70,917 | $11,809 | $59,108 |
| 2023 | $3,539 | $70,917 | $11,809 | $59,108 |
| 2022 | $3,605 | $56,284 | $9,373 | $46,911 |
| 2021 | $3,618 | $56,284 | $9,373 | $46,911 |
| 2020 | $3,555 | $56,280 | $9,370 | $46,910 |
| 2019 | $4,109 | $58,310 | $9,370 | $48,940 |
| 2018 | $3,545 | $58,310 | $9,370 | $48,940 |
| 2017 | $3,346 | $58,310 | $9,370 | $48,940 |
| 2016 | $3,306 | $49,870 | $9,370 | $40,500 |
| 2015 | $3,346 | $49,870 | $9,370 | $40,500 |
| 2014 | $3,321 | $49,870 | $9,370 | $40,500 |
| 2013 | $3,022 | $45,660 | $9,370 | $36,290 |
Source: Public Records
Map
Nearby Homes
- 5776 Harter Home Dr
- 781 Leeman Dr
- 715 Highland Park Dr
- 6090 Manchester Rd Unit 6096
- 1062 Stump Rd
- 5892 Woodward Dr
- 427 Center Rd
- 899 Loway Dr
- 451 Yager Rd
- 6387 Hampsher Rd
- 6407 Southview Dr
- 4944 Coleman Dr
- S/L 14,15 Shakes Hotel Dr
- 6 Shrakes Hotel Dr
- 4 Shrakes Hotel Dr
- 7 Shrakes Hotel Dr
- 5 Shrakes Hotel Dr
- 3 Shrakes Hotel Dr
- 4881 S Main St
- 0 W Comet Rd Unit 5079117
- 5717 Towerview Dr
- 5707 Towerview Dr
- 5747 Towerview Dr
- 5654 Bonnie Lou Dr
- 5697 Towerview Dr
- 5728 Towerview Dr
- 5646 Bonnie Lou Dr
- 5718 Towerview Dr
- 5738 Towerview Dr
- 5708 Towerview Dr
- 5748 Towerview Dr
- 715 Pearlman Rd
- 5638 Bonnie Lou Dr
- 725 Pearlman Rd
- 705 Pearlman Rd
- 695 Pearlman Rd
- 5662 Bonnie Lou Dr
- 5698 Towerview Dr
- 739 Pearlman Rd
- 685 Pearlman Rd