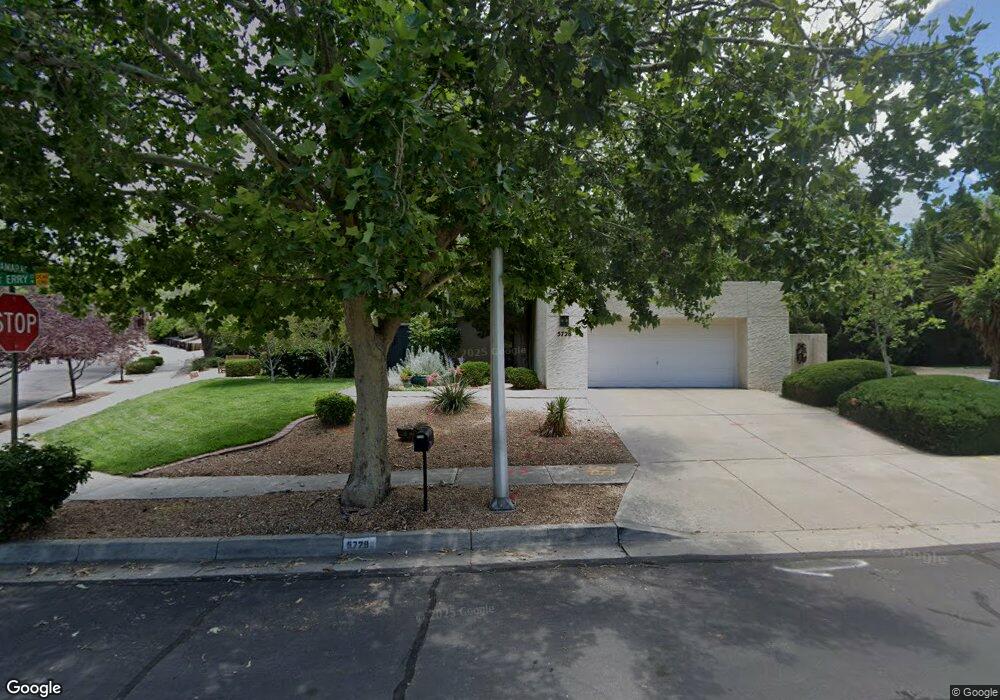
5728 Elderberry Ct NE Albuquerque, NM 87111
Peppertree-Royal Oak NeighborhoodEstimated Value: $607,000 - $640,000
4
Beds
2
Baths
2,365
Sq Ft
$264/Sq Ft
Est. Value
About This Home
This home is located at 5728 Elderberry Ct NE, Albuquerque, NM 87111 and is currently estimated at $624,306, approximately $263 per square foot. 5728 Elderberry Ct NE is a home located in Bernalillo County with nearby schools including Eldorado High School, Georgia O'Keefe Elementary School, and Eisenhower Middle School.
Ownership History
Date
Name
Owned For
Owner Type
Purchase Details
Closed on
Jun 1, 2005
Sold by
Fresquez Lorena G and Fresquez Arthur L
Bought by
Williams David Paul and Williams Carla Cay
Current Estimated Value
Home Financials for this Owner
Home Financials are based on the most recent Mortgage that was taken out on this home.
Original Mortgage
$234,000
Outstanding Balance
$121,931
Interest Rate
5.83%
Mortgage Type
Fannie Mae Freddie Mac
Estimated Equity
$502,375
Purchase Details
Closed on
Apr 26, 2001
Sold by
Hamill James R and Hamill Jane M
Bought by
Fresquez Arthur L and Fresquez Lorena G
Home Financials for this Owner
Home Financials are based on the most recent Mortgage that was taken out on this home.
Original Mortgage
$175,400
Interest Rate
6.75%
Create a Home Valuation Report for This Property
The Home Valuation Report is an in-depth analysis detailing your home's value as well as a comparison with similar homes in the area
Home Values in the Area
Average Home Value in this Area
Purchase History
| Date | Buyer | Sale Price | Title Company |
|---|---|---|---|
| Williams David Paul | -- | Fidelity National Title Co | |
| Fresquez Arthur L | -- | First American Title Ins Co |
Source: Public Records
Mortgage History
| Date | Status | Borrower | Loan Amount |
|---|---|---|---|
| Open | Williams David Paul | $234,000 | |
| Previous Owner | Fresquez Arthur L | $175,400 | |
| Closed | Fresquez Arthur L | $43,850 | |
| Closed | Williams David Paul | $50,000 |
Source: Public Records
Tax History Compared to Growth
Tax History
| Year | Tax Paid | Tax Assessment Tax Assessment Total Assessment is a certain percentage of the fair market value that is determined by local assessors to be the total taxable value of land and additions on the property. | Land | Improvement |
|---|---|---|---|---|
| 2025 | $5,721 | $141,725 | $28,012 | $113,713 |
| 2024 | $5,721 | $137,598 | $27,197 | $110,401 |
| 2023 | $5,623 | $133,590 | $26,405 | $107,185 |
| 2022 | $5,431 | $129,700 | $25,636 | $104,064 |
| 2021 | $5,247 | $125,922 | $24,889 | $101,033 |
| 2020 | $5,158 | $122,254 | $24,164 | $98,090 |
| 2019 | $5,160 | $122,321 | $24,164 | $98,157 |
| 2018 | $5,155 | $122,321 | $24,164 | $98,157 |
| 2017 | $4,994 | $123,005 | $27,197 | $95,808 |
| 2016 | $4,933 | $115,945 | $25,636 | $90,309 |
| 2015 | $112,568 | $112,568 | $24,889 | $87,679 |
| 2014 | $4,641 | $109,289 | $24,164 | $85,125 |
| 2013 | -- | $120,588 | $24,164 | $96,424 |
Source: Public Records
Map
Nearby Homes
- 5712 Papaya Place NE
- 12405 Royal Oak Ct NE
- 12501 Mckay Way NE
- 6109 Chamblee Ct NE
- 5404 Vista Lejana NE
- 6112 Innsbrook Ct NE
- 5801 Lowell St NE Unit 24B
- 5309 Avenida Cuesta NE
- 11812 Arroyo de Vista NE
- 5723 Bosque Vista Dr NE
- 11908 Oryx Place NE
- 6225 Peachtree Place NE
- 12612 Desert Marigold Ln NE
- 12616 Northern Sky Ave NE
- 11628 Woodmar Ln NE
- 12800 Northern Sky Ave NE
- 11829 Caribou Ave NE
- 11425 Malaguena Ln NE
- 12724 Sandia Ridge Place NE
- 5604 Mariola Place NE
- 5724 Elderberry Ct NE
- 0 Royal Oak St NE Unit 86205
- 0 Royal Oak St NE Unit 734491
- 5729 Teakwood Trail NE
- 12301 Tamarac Trail NE
- 12209 Tamarac Trail NE
- 5733 Teakwood Trail NE
- 5725 Teakwood Trail NE
- 5720 Elderberry Ct NE
- 5725 Elderberry Ct NE
- 5725 Elderberry Ct NE Unit 1
- 12205 Tamarac Trail NE
- 5721 Elderberry Ct NE
- 5721 Teakwood Trail NE
- 5716 Elderberry Ct NE
- 5717 Elderberry Ct NE
- 12208 Papaya Ct NE
- 5717 Teakwood Trail NE
- 12204 Papaya Ct NE
- 12201 Tamarac Trail NE