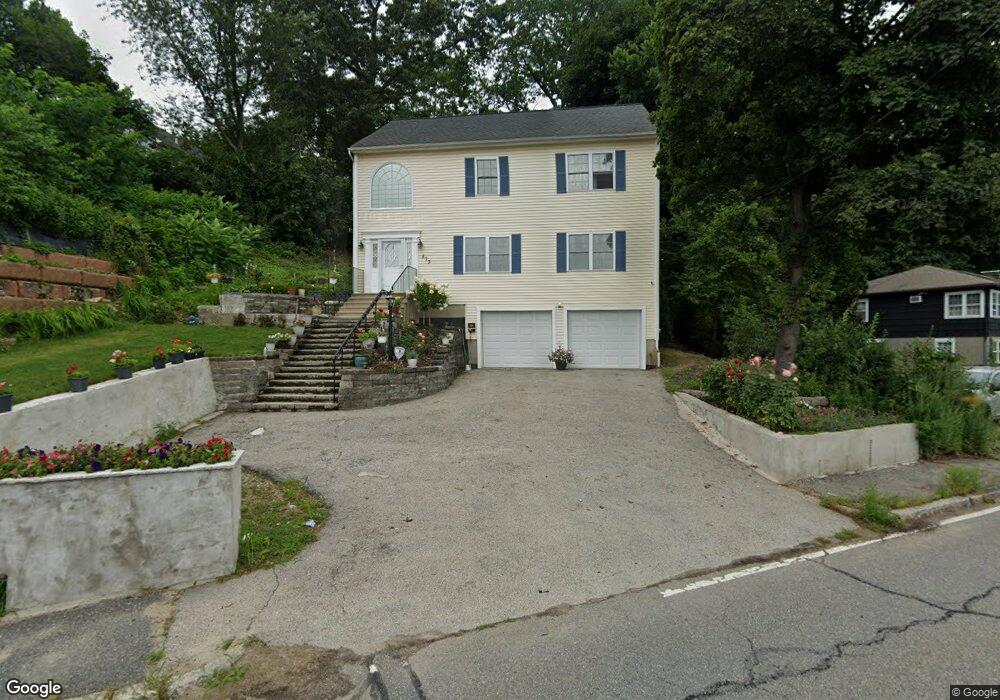
573 Grove St Worcester, MA 01605
Forest Grove NeighborhoodEstimated Value: $516,679 - $577,000
3
Beds
3
Baths
1,908
Sq Ft
$284/Sq Ft
Est. Value
About This Home
This home is located at 573 Grove St, Worcester, MA 01605 and is currently estimated at $541,170, approximately $283 per square foot. 573 Grove St is a home located in Worcester County with nearby schools including Nelson Place Elementary School, Jacob Hiatt Magnet School, and Chandler Magnet.
Ownership History
Date
Name
Owned For
Owner Type
Purchase Details
Closed on
Apr 16, 2021
Sold by
Hopkins Stephen M and Li Hong
Bought by
Grabocka Niko and Grabocka Gentiana
Current Estimated Value
Home Financials for this Owner
Home Financials are based on the most recent Mortgage that was taken out on this home.
Original Mortgage
$332,500
Outstanding Balance
$300,207
Interest Rate
3%
Mortgage Type
Purchase Money Mortgage
Estimated Equity
$240,963
Purchase Details
Closed on
Dec 3, 2008
Sold by
Downey Svgs&Loan Assn
Bought by
Hopkins Stephen M
Home Financials for this Owner
Home Financials are based on the most recent Mortgage that was taken out on this home.
Original Mortgage
$168,000
Interest Rate
6.11%
Mortgage Type
Purchase Money Mortgage
Purchase Details
Closed on
Jul 16, 2008
Sold by
Serafim Andresa
Bought by
Downey Svgs&Loan Assn
Purchase Details
Closed on
Jul 8, 2004
Sold by
By Design Inc
Bought by
Serafim Andresa
Home Financials for this Owner
Home Financials are based on the most recent Mortgage that was taken out on this home.
Original Mortgage
$274,500
Interest Rate
6.32%
Mortgage Type
Purchase Money Mortgage
Purchase Details
Closed on
Jul 9, 2003
Sold by
Seligowski Jeanne M and Seligowski Louis S
Bought by
By Design Inc
Create a Home Valuation Report for This Property
The Home Valuation Report is an in-depth analysis detailing your home's value as well as a comparison with similar homes in the area
Home Values in the Area
Average Home Value in this Area
Purchase History
| Date | Buyer | Sale Price | Title Company |
|---|---|---|---|
| Grabocka Niko | $350,000 | None Available | |
| Hopkins Stephen M | $210,000 | -- | |
| Downey Svgs&Loan Assn | $270,000 | -- | |
| Serafim Andresa | $305,000 | -- | |
| By Design Inc | -- | -- |
Source: Public Records
Mortgage History
| Date | Status | Borrower | Loan Amount |
|---|---|---|---|
| Open | Grabocka Niko | $332,500 | |
| Previous Owner | Hopkins Stephen M | $168,000 | |
| Previous Owner | Serafim Andresa | $274,500 |
Source: Public Records
Tax History
| Year | Tax Paid | Tax Assessment Tax Assessment Total Assessment is a certain percentage of the fair market value that is determined by local assessors to be the total taxable value of land and additions on the property. | Land | Improvement |
|---|---|---|---|---|
| 2025 | $6,177 | $468,300 | $122,600 | $345,700 |
| 2024 | $6,093 | $443,100 | $122,600 | $320,500 |
| 2023 | $5,848 | $407,800 | $105,500 | $302,300 |
| 2022 | $5,457 | $358,800 | $84,400 | $274,400 |
| 2021 | $5,459 | $335,300 | $67,500 | $267,800 |
| 2020 | $5,321 | $313,000 | $67,400 | $245,600 |
| 2019 | $5,200 | $288,900 | $64,900 | $224,000 |
| 2018 | $5,168 | $273,300 | $64,900 | $208,400 |
| 2017 | $4,963 | $258,200 | $64,900 | $193,300 |
| 2016 | $5,058 | $245,400 | $52,500 | $192,900 |
| 2015 | $4,925 | $245,400 | $52,500 | $192,900 |
| 2014 | $4,778 | $244,500 | $52,500 | $192,000 |
Source: Public Records
Map
Nearby Homes
Your Personal Tour Guide
Ask me questions while you tour the home.