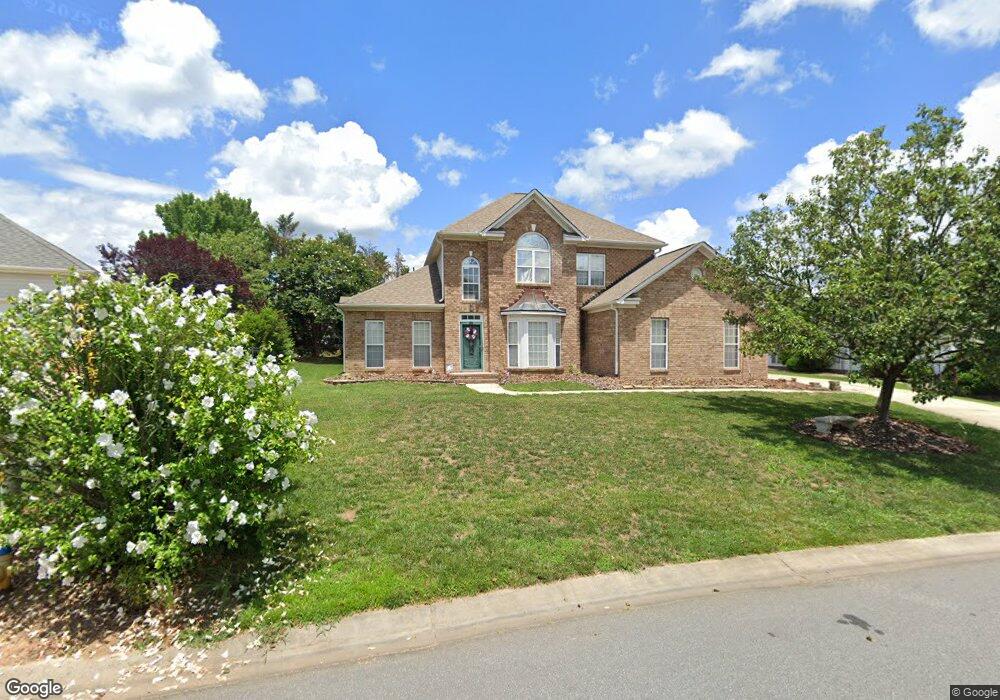
573 Surry Trace Cir NW Concord, NC 28027
Estimated Value: $470,000 - $506,000
4
Beds
3
Baths
2,510
Sq Ft
$197/Sq Ft
Est. Value
About This Home
This home is located at 573 Surry Trace Cir NW, Concord, NC 28027 and is currently estimated at $494,123, approximately $196 per square foot. 573 Surry Trace Cir NW is a home located in Cabarrus County with nearby schools including Carl A. Furr Elementary School, Harold E. Winkler Middle School, and Cabarrus Charter Academy.
Ownership History
Date
Name
Owned For
Owner Type
Purchase Details
Closed on
Jun 19, 2009
Sold by
Kiker Bryan D
Bought by
Kiker Kerri L
Current Estimated Value
Purchase Details
Closed on
Apr 1, 2008
Sold by
Race William B and Race Angela S
Bought by
Kiker Bryan D and Kiker Kerri L
Home Financials for this Owner
Home Financials are based on the most recent Mortgage that was taken out on this home.
Original Mortgage
$212,800
Outstanding Balance
$132,748
Interest Rate
5.68%
Mortgage Type
Purchase Money Mortgage
Estimated Equity
$361,375
Purchase Details
Closed on
May 31, 2000
Sold by
Niblock Development Corp
Bought by
Race William B and Race Angela S
Home Financials for this Owner
Home Financials are based on the most recent Mortgage that was taken out on this home.
Original Mortgage
$199,500
Interest Rate
7.75%
Purchase Details
Closed on
Oct 21, 1999
Sold by
Whitaker Donald E and Frisch Ann D
Bought by
Niblock Development Corp
Create a Home Valuation Report for This Property
The Home Valuation Report is an in-depth analysis detailing your home's value as well as a comparison with similar homes in the area
Home Values in the Area
Average Home Value in this Area
Purchase History
| Date | Buyer | Sale Price | Title Company |
|---|---|---|---|
| Kiker Kerri L | -- | None Available | |
| Kiker Bryan D | $266,000 | None Available | |
| Race William B | $210,000 | -- | |
| Niblock Development Corp | $25,500 | -- |
Source: Public Records
Mortgage History
| Date | Status | Borrower | Loan Amount |
|---|---|---|---|
| Open | Kiker Bryan D | $212,800 | |
| Closed | Kiker Bryan D | $33,000 | |
| Previous Owner | Race William B | $199,500 |
Source: Public Records
Tax History Compared to Growth
Tax History
| Year | Tax Paid | Tax Assessment Tax Assessment Total Assessment is a certain percentage of the fair market value that is determined by local assessors to be the total taxable value of land and additions on the property. | Land | Improvement |
|---|---|---|---|---|
| 2025 | $4,466 | $448,400 | $90,000 | $358,400 |
| 2024 | $4,466 | $448,400 | $90,000 | $358,400 |
| 2023 | $3,347 | $274,340 | $55,000 | $219,340 |
| 2022 | $3,347 | $274,340 | $55,000 | $219,340 |
| 2021 | $3,347 | $274,340 | $55,000 | $219,340 |
| 2020 | $3,347 | $274,340 | $55,000 | $219,340 |
| 2019 | $2,915 | $238,930 | $40,000 | $198,930 |
| 2018 | $2,867 | $238,930 | $40,000 | $198,930 |
| 2017 | $2,819 | $238,930 | $40,000 | $198,930 |
| 2016 | $1,673 | $202,110 | $35,000 | $167,110 |
| 2015 | $2,385 | $202,110 | $35,000 | $167,110 |
| 2014 | $2,385 | $202,110 | $35,000 | $167,110 |
Source: Public Records
Map
Nearby Homes
- 597 Gatsby Place NW
- 6525 Derby Ln NW
- 1337 Braeburn Rd NW
- 1231 Bennington Dr NW
- 888 Craigmont Ln NW
- 6119 Village Dr NW
- 1507 Chadmore Ln NW
- 5618 Burck Dr NW
- 5505 Yorke St NW
- 5619 Weddington Rd
- 5807 Monticello Dr NW
- 75 Mccurdy St NW Unit 75
- 5811 Monticello Dr NW
- 1735 Park Grove Place NW
- 439 Beacon St NW
- 447 Beacon St NW
- 5554 Village Dr NW
- 5461 Ives St NW
- 5711 Monticello Dr NW
- 4940 Weddington Rd NW
- 573 Surrey Trace Cir NW
- 569 Surrey Trace Cir NW
- 577 Surry Trace Cir NW
- 577 Surrey Trace Cir NW
- 574 Surry Trace Cir NW
- 565 Surry Trace Cir NW
- 574 Surrey Trace Cir NW
- 570 Surrey Trace Cir NW
- 578 Surrey Trace Cir NW
- 581 Surrey Trace Cir NW
- 566 Surrey Trace Cir NW
- 6593 Gatehouse Ct NW
- 582 Surrey Trace Cir NW
- 511 Roxanne Ct NW
- 561 Surrey Trace Cir NW
- 585 Surrey Trace Cir NW
- 510 Roxanne Ct NW
- 562 Surrey Trace Cir NW
- 562 Surrey Trace Cir NW Unit 127
- 6589 Gatehouse Ct NW