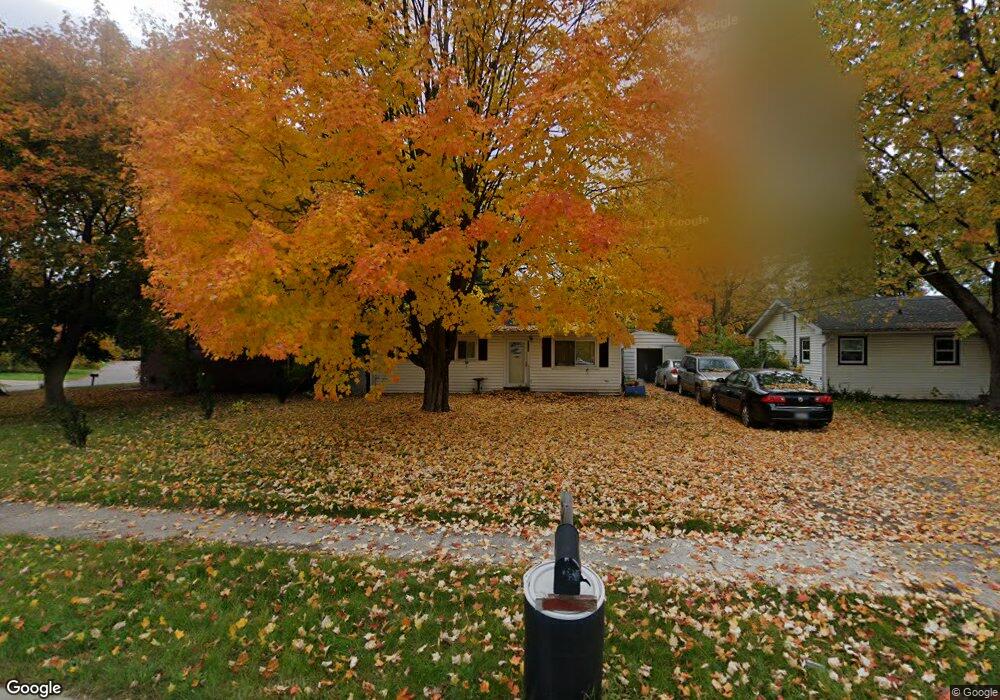
5732 Haag Rd Lansing, MI 48911
Southern Lansing NeighborhoodEstimated Value: $88,731 - $146,000
3
Beds
1
Bath
864
Sq Ft
$139/Sq Ft
Est. Value
About This Home
This home is located at 5732 Haag Rd, Lansing, MI 48911 and is currently estimated at $119,933, approximately $138 per square foot. 5732 Haag Rd is a home located in Ingham County with nearby schools including Reo Elementary School, Attwood School, and Everett High School.
Ownership History
Date
Name
Owned For
Owner Type
Purchase Details
Closed on
Nov 7, 2016
Sold by
Berry Amber O and Wallace Amber
Bought by
Portee Anthony
Current Estimated Value
Home Financials for this Owner
Home Financials are based on the most recent Mortgage that was taken out on this home.
Original Mortgage
$69,000
Outstanding Balance
$55,395
Interest Rate
3.42%
Mortgage Type
Seller Take Back
Estimated Equity
$64,538
Purchase Details
Closed on
Feb 10, 2005
Sold by
Brooks Mary J
Bought by
Wachovia Bank Na and Long Beach Mortgage Loan Trust 2000-1
Purchase Details
Closed on
Nov 28, 2000
Sold by
Stevenson Darahann C
Bought by
Brooks Mary J
Home Financials for this Owner
Home Financials are based on the most recent Mortgage that was taken out on this home.
Original Mortgage
$56,100
Interest Rate
12.35%
Mortgage Type
Purchase Money Mortgage
Create a Home Valuation Report for This Property
The Home Valuation Report is an in-depth analysis detailing your home's value as well as a comparison with similar homes in the area
Home Values in the Area
Average Home Value in this Area
Purchase History
| Date | Buyer | Sale Price | Title Company |
|---|---|---|---|
| Portee Anthony | $69,000 | None Available | |
| Wachovia Bank Na | $72,969 | -- | |
| Brooks Mary J | $66,000 | -- |
Source: Public Records
Mortgage History
| Date | Status | Borrower | Loan Amount |
|---|---|---|---|
| Open | Portee Anthony | $69,000 | |
| Previous Owner | Brooks Mary J | $56,100 | |
| Closed | Brooks Mary J | $9,900 |
Source: Public Records
Tax History
| Year | Tax Paid | Tax Assessment Tax Assessment Total Assessment is a certain percentage of the fair market value that is determined by local assessors to be the total taxable value of land and additions on the property. | Land | Improvement |
|---|---|---|---|---|
| 2025 | $2,541 | $44,300 | $7,700 | $36,600 |
| 2024 | $21 | $39,600 | $7,700 | $31,900 |
| 2023 | $2,392 | $36,200 | $7,700 | $28,500 |
| 2022 | $2,185 | $31,600 | $7,700 | $23,900 |
| 2021 | $2,135 | $28,300 | $5,000 | $23,300 |
| 2020 | $2,120 | $26,700 | $5,000 | $21,700 |
| 2019 | $2,048 | $25,400 | $5,000 | $20,400 |
| 2018 | $1,499 | $24,400 | $5,000 | $19,400 |
| 2017 | $2,076 | $24,400 | $5,000 | $19,400 |
| 2016 | $1,598 | $22,200 | $5,000 | $17,200 |
| 2015 | $1,598 | $21,000 | $10,099 | $10,901 |
| 2014 | $1,598 | $20,900 | $15,709 | $5,191 |
Source: Public Records
Map
Nearby Homes
- 5723 Taffy Pkwy
- 5902 Haag Rd
- 1406 Weymouth Ct
- 5641 Ashley Dr
- 5650 Hughes Rd
- 6037 Hughes Rd
- 1015 Brad St
- 1020 R G Curtiss Ave
- 6235 Yunker St
- 0 Midwood St
- 1808 W Jolly Rd
- 0 W Jolly Rd
- 5017 Christiansen Rd
- 1301 S Briarfield Dr
- 1215 S Briarfield Dr
- 4928 Hughes Rd
- 5902 Hilliard Rd
- 4927 Starr Ave
- 4908 Hughes Rd
- 4926 Burchfield Ave
- 5726 Haag Rd
- 5800 Durwell Dr
- 5812 Durwell Dr
- 5722 Haag Rd
- 5818 Durwell Dr
- 5633 Taffy Pkwy
- 5701 Taffy Pkwy
- 5716 Haag Rd
- 5801 Durwell Dr
- 5627 Taffy Pkwy
- 5749 Ashley Dr
- 5707 Taffy Pkwy
- 5826 Durwell Dr
- 5824 Durwell Dr
- 5621 Taffy Pkwy
- 5713 Taffy Pkwy
- 5819 Durwell Dr
- 5816 Haag Rd
- 5743 Ashley Dr
- 5717 Taffy Pkwy
Your Personal Tour Guide
Ask me questions while you tour the home.