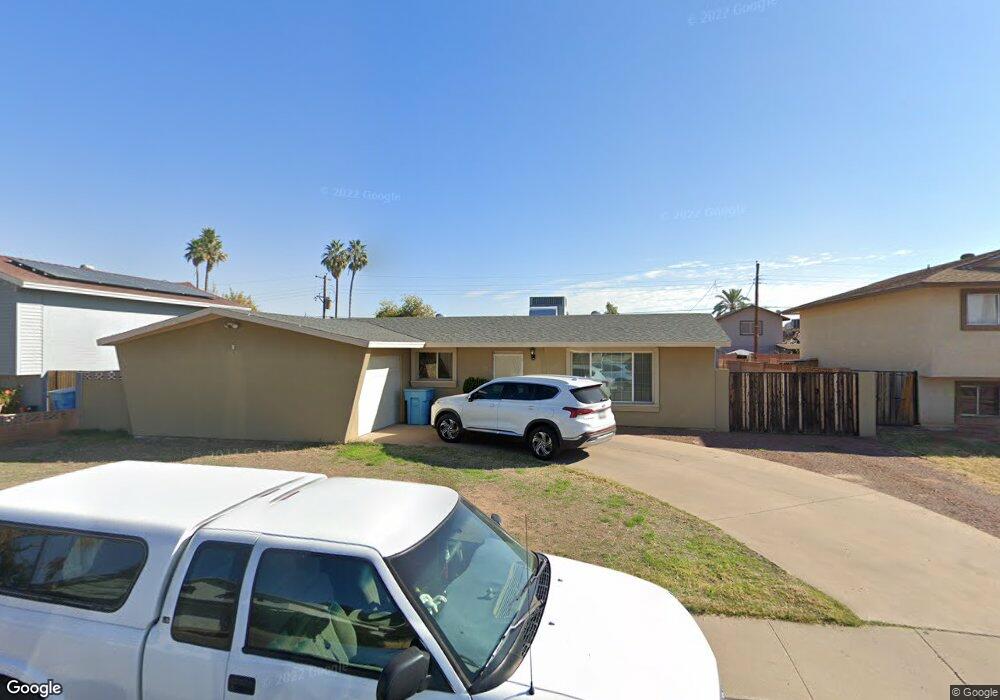
5733 N 41st Dr Phoenix, AZ 85019
Alhambra NeighborhoodEstimated Value: $278,000 - $347,000
Studio
2
Baths
1,380
Sq Ft
$215/Sq Ft
Est. Value
About This Home
This home is located at 5733 N 41st Dr, Phoenix, AZ 85019 and is currently estimated at $296,976, approximately $215 per square foot. 5733 N 41st Dr is a home located in Maricopa County with nearby schools including Sevilla Elementary School East, Sevilla Elementary School West, and Alhambra High School.
Ownership History
Date
Name
Owned For
Owner Type
Purchase Details
Closed on
Aug 24, 1999
Sold by
John Jacqueline R
Bought by
John Antonio
Current Estimated Value
Purchase Details
Closed on
Mar 2, 1994
Sold by
Smith Lynette J
Bought by
Ross James A
Home Financials for this Owner
Home Financials are based on the most recent Mortgage that was taken out on this home.
Original Mortgage
$54,332
Interest Rate
7.15%
Mortgage Type
FHA
Create a Home Valuation Report for This Property
The Home Valuation Report is an in-depth analysis detailing your home's value as well as a comparison with similar homes in the area
Home Values in the Area
Average Home Value in this Area
Purchase History
| Date | Buyer | Sale Price | Title Company |
|---|---|---|---|
| John Antonio | -- | Fidelity Title | |
| John Antonio | $82,000 | Fidelity Title | |
| Ross James A | $54,000 | Old Republic Title Agency |
Source: Public Records
Mortgage History
| Date | Status | Borrower | Loan Amount |
|---|---|---|---|
| Previous Owner | Ross James A | $54,332 |
Source: Public Records
Tax History
| Year | Tax Paid | Tax Assessment Tax Assessment Total Assessment is a certain percentage of the fair market value that is determined by local assessors to be the total taxable value of land and additions on the property. | Land | Improvement |
|---|---|---|---|---|
| 2025 | $946 | $6,642 | -- | -- |
| 2024 | $859 | $6,325 | -- | -- |
| 2023 | $859 | $24,510 | $4,900 | $19,610 |
| 2022 | $846 | $18,430 | $3,680 | $14,750 |
| 2021 | $861 | $16,000 | $3,200 | $12,800 |
| 2020 | $826 | $14,400 | $2,880 | $11,520 |
| 2019 | $816 | $12,860 | $2,570 | $10,290 |
| 2018 | $747 | $12,030 | $2,400 | $9,630 |
| 2017 | $739 | $9,460 | $1,890 | $7,570 |
| 2016 | $706 | $8,110 | $1,620 | $6,490 |
| 2015 | $671 | $6,680 | $1,330 | $5,350 |
Source: Public Records
Map
Nearby Homes
- 4051 W Montebello Ave
- 4117 W San Juan Ave
- 4019 W San Miguel Ave
- 5742 N 43rd Dr
- 6044 N 42nd Ave
- 3851 W Solano Dr
- 5632 N 38th Dr
- 4400 W Missouri Ave Unit 46
- 4400 W Missouri Ave Unit 249
- 4400 W Missouri Ave Unit 216
- 4400 W Missouri Ave Unit 265
- 4400 W Missouri Ave Unit 25
- 4400 W Missouri Ave Unit 302
- 4400 W Missouri Ave Unit 143
- 4400 W Missouri Ave Unit 280
- 4400 W Missouri Ave Unit 205
- 3939 W Cavalier Dr
- 5524 N 39th Ave
- 5610 N 38th Dr Unit 3
- 5617 N 38th Dr
- 5727 N 41st Dr
- 5739 N 41st Dr
- 5732 N 41st Ave
- 5738 N 41st Ave
- 5726 N 41st Ave
- 5721 N 41st Dr
- 5745 N 41st Dr
- 5734 N 41st Dr
- 5740 N 41st Dr
- 5744 N 41st Ave
- 5728 N 41st Dr
- 5722 N 41st Ave
- 5746 N 41st Dr
- 5751 N 41st Dr
- 5715 N 41st Dr
- 5722 N 41st Dr
- 5748 N 41st Ave
- 5718 N 41st Ave
- 5752 N 41st Dr
- 5735 N 42nd Ave
Your Personal Tour Guide
Ask me questions while you tour the home.