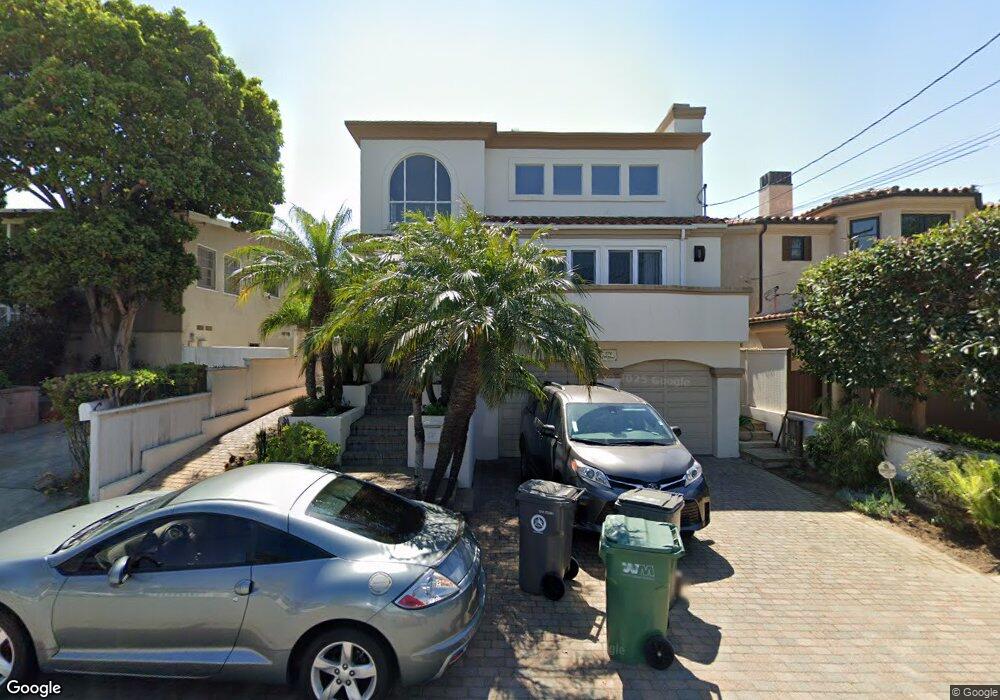
574 29th St Manhattan Beach, CA 90266
Estimated Value: $3,988,383 - $4,819,000
5
Beds
4
Baths
4,012
Sq Ft
$1,057/Sq Ft
Est. Value
About This Home
This home is located at 574 29th St, Manhattan Beach, CA 90266 and is currently estimated at $4,241,596, approximately $1,057 per square foot. 574 29th St is a home located in Los Angeles County with nearby schools including Grand View Elementary School, Manhattan Beach Middle School, and Mira Costa High School.
Ownership History
Date
Name
Owned For
Owner Type
Purchase Details
Closed on
Dec 23, 2015
Sold by
Ham Tai Heon and Ham Ok Ran
Bought by
Ham Tai Heon and Ham Ok Ran
Current Estimated Value
Home Financials for this Owner
Home Financials are based on the most recent Mortgage that was taken out on this home.
Original Mortgage
$961,880
Outstanding Balance
$756,267
Interest Rate
3.94%
Mortgage Type
New Conventional
Estimated Equity
$3,485,329
Purchase Details
Closed on
Oct 20, 2008
Sold by
Ham Tai Heon and Ham Ok Ran
Bought by
Ham Tai Heon and Ham Ok Ran
Home Financials for this Owner
Home Financials are based on the most recent Mortgage that was taken out on this home.
Original Mortgage
$1,110,000
Interest Rate
6%
Mortgage Type
New Conventional
Purchase Details
Closed on
Aug 25, 2008
Sold by
Ham Tai Heon and Ham Ok Ram
Bought by
Ham Tai Heon and Ham Oak Ran
Home Financials for this Owner
Home Financials are based on the most recent Mortgage that was taken out on this home.
Original Mortgage
$1,110,000
Interest Rate
6%
Mortgage Type
New Conventional
Purchase Details
Closed on
Sep 10, 2002
Sold by
Ham Ok Ran
Bought by
Ham Tai Heon
Home Financials for this Owner
Home Financials are based on the most recent Mortgage that was taken out on this home.
Original Mortgage
$520,000
Interest Rate
6.24%
Purchase Details
Closed on
Dec 2, 1998
Sold by
Jordan Jeffrey D and Jordan Karen Shishino
Bought by
Ham Tai Heon and Ham Ok Ran
Home Financials for this Owner
Home Financials are based on the most recent Mortgage that was taken out on this home.
Original Mortgage
$637,000
Interest Rate
6.73%
Purchase Details
Closed on
Apr 8, 1998
Sold by
Jordan Jeffrey D and Jordan Karen Shishino
Bought by
Jordan Jeffrey D and Jordan Karen Shishino
Purchase Details
Closed on
Mar 20, 1997
Sold by
Marcus Robert M and Marcus Marcia
Bought by
Jordan Jeffrey D and Jordan Karen Shishino
Home Financials for this Owner
Home Financials are based on the most recent Mortgage that was taken out on this home.
Original Mortgage
$679,900
Interest Rate
7.75%
Create a Home Valuation Report for This Property
The Home Valuation Report is an in-depth analysis detailing your home's value as well as a comparison with similar homes in the area
Home Values in the Area
Average Home Value in this Area
Purchase History
| Date | Buyer | Sale Price | Title Company |
|---|---|---|---|
| Ham Tai Heon | -- | Chicago Title Company | |
| Ham Tai Heon | -- | None Available | |
| Ham Tai Heon | -- | Chicago Title | |
| Ham Tai Heon | -- | Chicago Title Co | |
| Ham Tai Heon | $910,000 | Chicago Title Co | |
| Jordan Jeffrey D | -- | Investors Title Company | |
| Jordan Jeffrey D | $850,000 | Title Land Company |
Source: Public Records
Mortgage History
| Date | Status | Borrower | Loan Amount |
|---|---|---|---|
| Open | Ham Tai Heon | $961,880 | |
| Closed | Ham Tai Heon | $1,110,000 | |
| Closed | Ham Tai Heon | $520,000 | |
| Closed | Ham Tai Heon | $637,000 | |
| Previous Owner | Jordan Jeffrey D | $679,900 |
Source: Public Records
Tax History
| Year | Tax Paid | Tax Assessment Tax Assessment Total Assessment is a certain percentage of the fair market value that is determined by local assessors to be the total taxable value of land and additions on the property. | Land | Improvement |
|---|---|---|---|---|
| 2025 | $16,384 | $1,426,603 | $866,941 | $559,662 |
| 2024 | $16,384 | $1,398,632 | $849,943 | $548,689 |
| 2023 | $15,904 | $1,371,209 | $833,278 | $537,931 |
| 2022 | $15,632 | $1,344,324 | $816,940 | $527,384 |
| 2021 | $15,371 | $1,317,966 | $800,922 | $517,044 |
| 2019 | $14,962 | $1,278,876 | $777,167 | $501,709 |
| 2018 | $14,632 | $1,253,801 | $761,929 | $491,872 |
| 2016 | $13,505 | $1,205,117 | $732,344 | $472,773 |
| 2015 | $13,227 | $1,187,016 | $721,344 | $465,672 |
| 2014 | $13,046 | $1,163,765 | $707,214 | $456,551 |
Source: Public Records
Map
Nearby Homes
- 592 33rd St
- 612 33rd St
- 436 32nd St
- 2907 Crest Dr
- 425 23rd Place
- 323 31st St
- 316 32nd St
- 2215 Alma Ave
- 3216 Highland Ave
- 330 34th Place
- 2407 Manhattan Ave
- 3208 Manhattan Ave
- 320 35th St
- 2623 Laurel Ave
- 2420 The Strand
- 3520 Alma Ave
- 124 33rd Place
- 2007 Highland Ave
- 2208 The Strand
- 2200 The Strand Unit A
Your Personal Tour Guide
Ask me questions while you tour the home.