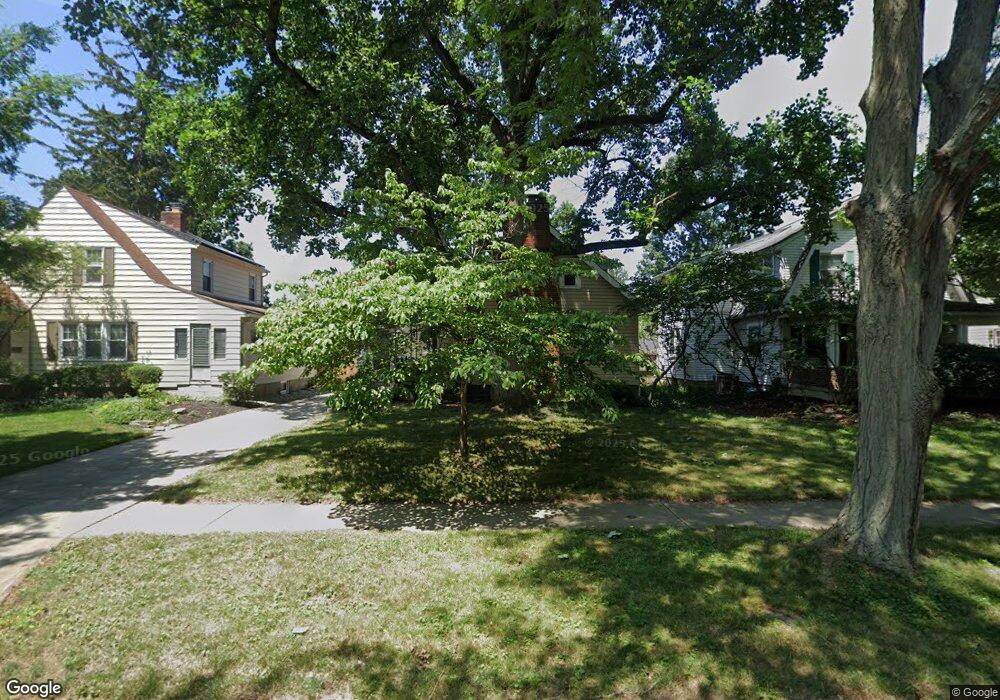
574 Arden Rd Columbus, OH 43214
Clintonville NeighborhoodEstimated Value: $363,000 - $500,000
3
Beds
2
Baths
1,597
Sq Ft
$279/Sq Ft
Est. Value
About This Home
This home is located at 574 Arden Rd, Columbus, OH 43214 and is currently estimated at $445,659, approximately $279 per square foot. 574 Arden Rd is a home located in Franklin County with nearby schools including Indian Springs Elementary School, Dominion Middle School, and Whetstone High School.
Ownership History
Date
Name
Owned For
Owner Type
Purchase Details
Closed on
May 24, 2007
Sold by
Wickersham Bonnie E
Bought by
Wickersham Bonnie E
Current Estimated Value
Purchase Details
Closed on
May 16, 2007
Sold by
Fernsler Ronald E and Fernsler Jenny S
Bought by
Wickersham Bonnie E
Purchase Details
Closed on
Nov 9, 2006
Sold by
Estate Of Darrel T Fernsler
Bought by
Wickersham Bonnie E and Darrel T Fernsler Trust
Purchase Details
Closed on
Jun 28, 2000
Sold by
Fernsler Darrel T
Bought by
Wickersham Bonnie E
Purchase Details
Closed on
Mar 30, 2000
Sold by
Fernsler Darrel T
Bought by
Fernsler Darrel T
Purchase Details
Closed on
Jun 4, 1999
Sold by
Fernsler Darrel T and Fernsler Jennie E
Bought by
Fernsler Darrel T and Fernsler Jennie E
Purchase Details
Closed on
May 27, 1999
Sold by
Kavanagh Robert E and Kavanagh Ida M
Bought by
Fernsler Darrel T and Fernsler Jennie E
Purchase Details
Closed on
May 10, 1999
Sold by
Estate Of Gwendolyn Z Kavanagh
Bought by
Kavanagh Robert Z and Kavanagh Ned D
Create a Home Valuation Report for This Property
The Home Valuation Report is an in-depth analysis detailing your home's value as well as a comparison with similar homes in the area
Home Values in the Area
Average Home Value in this Area
Purchase History
| Date | Buyer | Sale Price | Title Company |
|---|---|---|---|
| Wickersham Bonnie E | -- | Attorney | |
| Wickersham Bonnie E | -- | Attorney | |
| Wickersham Bonnie E | -- | None Available | |
| Wickersham Bonnie E | -- | -- | |
| Fernsler Ronald E | -- | -- | |
| Fernsler Darrel T | -- | -- | |
| Fernsler Darrel T | -- | -- | |
| Fernsler Darrel T | -- | Franklin Abstract | |
| Fernsler Darrel T | $130,000 | Franklin Abstract | |
| Kavanagh Robert Z | -- | -- |
Source: Public Records
Tax History Compared to Growth
Tax History
| Year | Tax Paid | Tax Assessment Tax Assessment Total Assessment is a certain percentage of the fair market value that is determined by local assessors to be the total taxable value of land and additions on the property. | Land | Improvement |
|---|---|---|---|---|
| 2024 | $5,457 | $119,070 | $52,990 | $66,080 |
| 2023 | $5,389 | $119,070 | $52,990 | $66,080 |
| 2022 | $5,985 | $112,630 | $34,580 | $78,050 |
| 2021 | $5,996 | $112,630 | $34,580 | $78,050 |
| 2020 | $5,949 | $111,580 | $34,580 | $77,000 |
| 2019 | $5,397 | $84,390 | $26,600 | $57,790 |
| 2018 | $4,899 | $84,390 | $26,600 | $57,790 |
| 2017 | $5,127 | $84,390 | $26,600 | $57,790 |
| 2016 | $5,008 | $73,710 | $27,440 | $46,270 |
| 2015 | $4,559 | $73,710 | $27,440 | $46,270 |
| 2014 | $4,570 | $73,710 | $27,440 | $46,270 |
| 2013 | $2,147 | $70,210 | $26,145 | $44,065 |
Source: Public Records
Map
Nearby Homes
- 540 Fallis Rd
- 467 Brevoort Rd
- 541 Northridge Rd
- 374 Acton Rd
- 780 Moon Rd
- 217 Arden Rd
- 3386 Beulah Rd
- 419 E North Broadway St
- 886 Carolyn Ave
- 876 Lenore Ave
- 685 Yaronia Dr N
- 3724 Eisenhower Rd
- 4000 Indianola Ave
- 924 Northridge Rd
- 569 Walhalla Rd
- 455 Walhalla Rd
- 3480 Maize Rd
- 612 E Como Ave
- 340 Canyon Dr S
- 3938 Eisenhower Rd