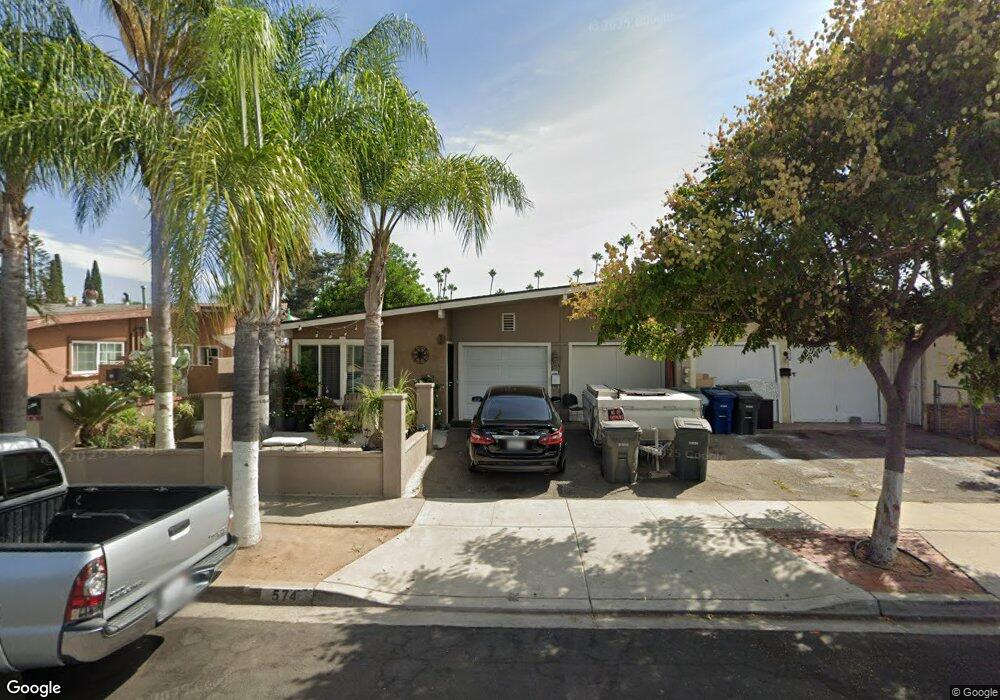
574 Begonia St Escondido, CA 92027
Midway NeighborhoodEstimated Value: $550,000 - $633,000
2
Beds
1
Bath
816
Sq Ft
$708/Sq Ft
Est. Value
About This Home
This home is located at 574 Begonia St, Escondido, CA 92027 and is currently estimated at $577,987, approximately $708 per square foot. 574 Begonia St is a home located in San Diego County with nearby schools including Rose Elementary School, Mission Middle, and Orange Glen High School.
Ownership History
Date
Name
Owned For
Owner Type
Purchase Details
Closed on
Oct 9, 2006
Sold by
Escarsia Maria
Bought by
Eliserio Jose Rosendo Escarsia
Current Estimated Value
Purchase Details
Closed on
Oct 16, 2001
Sold by
Daniel John J and Daniel Kristine L
Bought by
Escarcia Rosendo
Home Financials for this Owner
Home Financials are based on the most recent Mortgage that was taken out on this home.
Original Mortgage
$113,450
Outstanding Balance
$44,376
Interest Rate
6.88%
Estimated Equity
$533,611
Purchase Details
Closed on
Sep 24, 2001
Sold by
Daniel William H and Daniel John J
Bought by
Daniel John J and Daniel Kristine L
Home Financials for this Owner
Home Financials are based on the most recent Mortgage that was taken out on this home.
Original Mortgage
$113,450
Outstanding Balance
$44,376
Interest Rate
6.88%
Estimated Equity
$533,611
Purchase Details
Closed on
Aug 16, 2001
Sold by
Escarcia Maria
Bought by
Escarcia Rosendo
Create a Home Valuation Report for This Property
The Home Valuation Report is an in-depth analysis detailing your home's value as well as a comparison with similar homes in the area
Home Values in the Area
Average Home Value in this Area
Purchase History
| Date | Buyer | Sale Price | Title Company |
|---|---|---|---|
| Eliserio Jose Rosendo Escarsia | -- | Southland Title | |
| Eliserio Jose Rosendo Escarsia | -- | Southland Title | |
| Escarsia Rosendo | -- | Southland Title | |
| Escarcia Rosendo | $117,000 | Chicago Title Co | |
| Daniel John J | -- | Chicago Title Co | |
| Escarcia Rosendo | -- | Chicago Title Co |
Source: Public Records
Mortgage History
| Date | Status | Borrower | Loan Amount |
|---|---|---|---|
| Open | Escarcia Rosendo | $113,450 | |
| Closed | Escarcia Rosendo | $6,000 |
Source: Public Records
Tax History Compared to Growth
Tax History
| Year | Tax Paid | Tax Assessment Tax Assessment Total Assessment is a certain percentage of the fair market value that is determined by local assessors to be the total taxable value of land and additions on the property. | Land | Improvement |
|---|---|---|---|---|
| 2025 | $1,965 | $172,829 | $66,944 | $105,885 |
| 2024 | $1,965 | $169,441 | $65,632 | $103,809 |
| 2023 | $1,920 | $166,120 | $64,346 | $101,774 |
| 2022 | $1,899 | $162,864 | $63,085 | $99,779 |
| 2021 | $1,869 | $159,672 | $61,849 | $97,823 |
| 2020 | $1,858 | $158,035 | $61,215 | $96,820 |
| 2019 | $1,814 | $154,937 | $60,015 | $94,922 |
| 2018 | $1,764 | $151,900 | $58,839 | $93,061 |
| 2017 | $1,736 | $148,923 | $57,686 | $91,237 |
| 2016 | $1,702 | $146,004 | $56,555 | $89,449 |
| 2015 | $1,688 | $143,812 | $55,706 | $88,106 |
| 2014 | $1,617 | $140,996 | $54,615 | $86,381 |
Source: Public Records
Map
Nearby Homes
- 475 N Midway Dr Unit 230
- 475 N Midway Dr Unit 122
- 475 N Midway Dr Unit 139
- 1429 Taylor Ave
- 2280 E Valley Pkwy Unit 74
- 2280 E Valley Pkwy Unit 75
- 809 Buchanan St
- 1817 E Grand Ave Unit 6
- 1811 E Grand Ave Unit 175
- 1817 E Grand Ave Unit 77
- 1817 E Grand Ave Unit 56
- 1817 E Grand Ave Unit 63
- 1817 E Grand Ave Unit 72
- 1811 E Grand Ave Unit 89
- 1817 E Grand Ave Unit 49
- 1811 E Grand Ave Unit 149
- 2141 E Mission Ave
- 2033 Lee Dr
- 2041 E Grand Ave Unit 34
- 2041 E Grand Ave Unit 38
- 1735 Anza Place
- 1733 Anza Place
- 562 Begonia St
- 564 Begonia St
- 1744 Dawn Place
- 1742 Dawn Place
- 1743 Anza Place
- 1745 Anza Place
- 575 Begonia St
- 573 Begonia St
- 585 Begonia St
- 583 Begonia St
- 563 Begonia St
- 565 Begonia St
- 1754 Dawn Place
- 1752 Dawn Place
- 1752 Anza Place
- 1734 Anza Place
- 1732 Anza Place
- 555 Begonia St