Estimated Value: $384,000 - $466,000
2
Beds
2
Baths
1,352
Sq Ft
$324/Sq Ft
Est. Value
About This Home
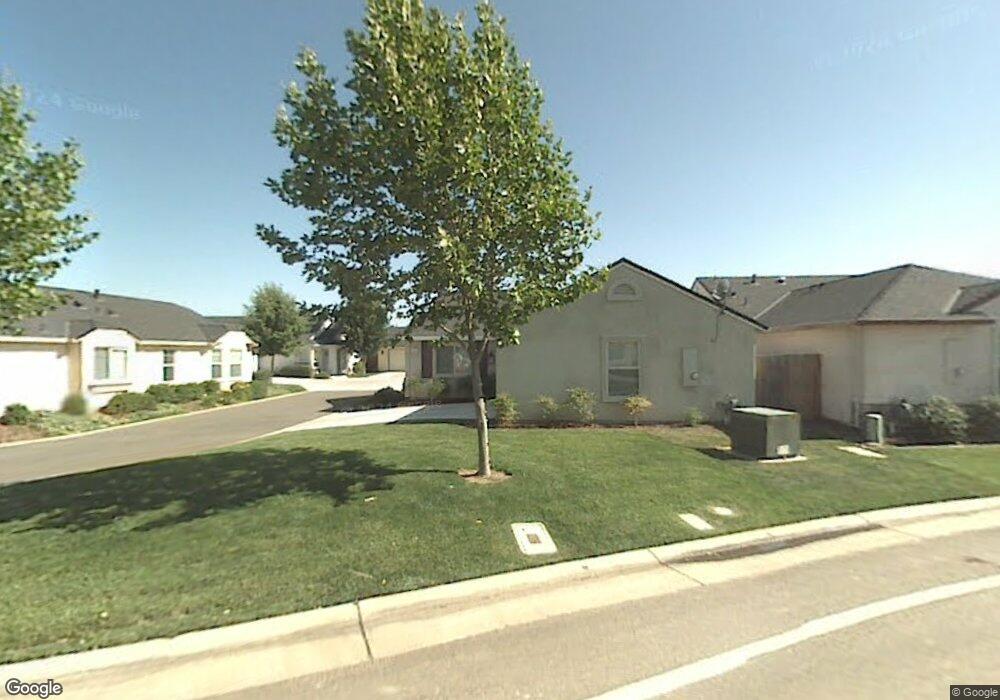
This home is located at 574 Wild Rose Dr, Galt, CA 95632 and is currently estimated at $437,436, approximately $323 per square foot. 574 Wild Rose Dr is a home located in Sacramento County with nearby schools including Lake Canyon Elementary School, Robert L. McCaffrey Middle School, and Liberty Ranch High School.
Ownership History
Date
Name
Owned For
Owner Type
Purchase Details
Closed on
Mar 9, 2021
Sold by
Ross Jackson L
Bought by
Ross Jackson Lee and Jackson Lee Ross
Current Estimated Value
Purchase Details
Closed on
Jul 10, 2018
Sold by
Ross Robert L
Bought by
Ross Robert L and Ross Jacquelyn L
Purchase Details
Closed on
Mar 28, 2012
Sold by
Ross Donald G and The Eleanor M Ross Living Trus
Bought by
Ross Donald G and Ross Robert L
Purchase Details
Closed on
Nov 14, 2006
Sold by
Ross Eleanor M
Bought by
Ross Eleanor M and The Eleanor M Ross Living Trus
Purchase Details
Closed on
Apr 11, 2006
Sold by
Scanlan Edward J
Bought by
Ross Eleanor M
Purchase Details
Closed on
Apr 13, 2004
Sold by
4 Gs Development Group Llc
Bought by
Scanlan Edward J
Home Financials for this Owner
Home Financials are based on the most recent Mortgage that was taken out on this home.
Original Mortgage
$153,600
Interest Rate
4.62%
Mortgage Type
Purchase Money Mortgage
Create a Home Valuation Report for This Property
The Home Valuation Report is an in-depth analysis detailing your home's value as well as a comparison with similar homes in the area
Home Values in the Area
Average Home Value in this Area
Purchase History
| Date | Buyer | Sale Price | Title Company |
|---|---|---|---|
| Ross Jackson Lee | -- | None Available | |
| Ross Robert L | -- | None Available | |
| Ross Donald G | -- | None Available | |
| Ross Eleanor M | -- | None Available | |
| Ross Eleanor M | $349,000 | Chicago Title Co | |
| Scanlan Edward J | $193,000 | Fidelity National Title Co |
Source: Public Records
Mortgage History
| Date | Status | Borrower | Loan Amount |
|---|---|---|---|
| Previous Owner | Scanlan Edward J | $153,600 |
Source: Public Records
Tax History Compared to Growth
Tax History
| Year | Tax Paid | Tax Assessment Tax Assessment Total Assessment is a certain percentage of the fair market value that is determined by local assessors to be the total taxable value of land and additions on the property. | Land | Improvement |
|---|---|---|---|---|
| 2025 | $5,323 | $476,916 | $136,646 | $340,270 |
| 2024 | $5,323 | $467,566 | $133,967 | $333,599 |
| 2023 | $4,892 | $428,000 | $115,000 | $313,000 |
| 2022 | $4,791 | $428,000 | $115,000 | $313,000 |
| 2021 | $4,389 | $383,421 | $109,859 | $273,562 |
| 2020 | $3,866 | $336,335 | $96,368 | $239,967 |
| 2019 | $3,616 | $315,809 | $90,487 | $225,322 |
| 2018 | $3,543 | $303,663 | $87,007 | $216,656 |
| 2017 | $3,164 | $276,058 | $79,098 | $196,960 |
| 2016 | $2,839 | $250,963 | $71,908 | $179,055 |
| 2015 | $2,845 | $241,312 | $69,143 | $172,169 |
| 2014 | $2,679 | $221,387 | $63,434 | $157,953 |
Source: Public Records
Map
Nearby Homes
- 606 Village Dr
- 677 Village Dr
- 737 Lake Canyon Ave
- 692 Arlene Ct
- 767 Lake Park Cir
- 1133 Bellawood Dr
- 1156 Monique St
- 1160 Monique St
- Residence 1883 Plan at The Cottages at Greenwood
- 2012 Seraphina St
- Residence 2448 Plan at Summerfield - Cedar Grove at Summerfield
- Residence 2760 Plan at Summerfield - Cedar Glen at Summerfield
- 1173 Monique St
- Residence 3308 Plan at Summerfield - Cedar Glen at Summerfield
- 1164 Monique St
- Residence 2072 Plan at The Towns at Greenwood
- Residence 2788 Plan at Summerfield - Cedar Glen at Summerfield
- 1169 Monique St
- 2016 Seraphina St
- Residence 1894 Plan at The Towns at Greenwood