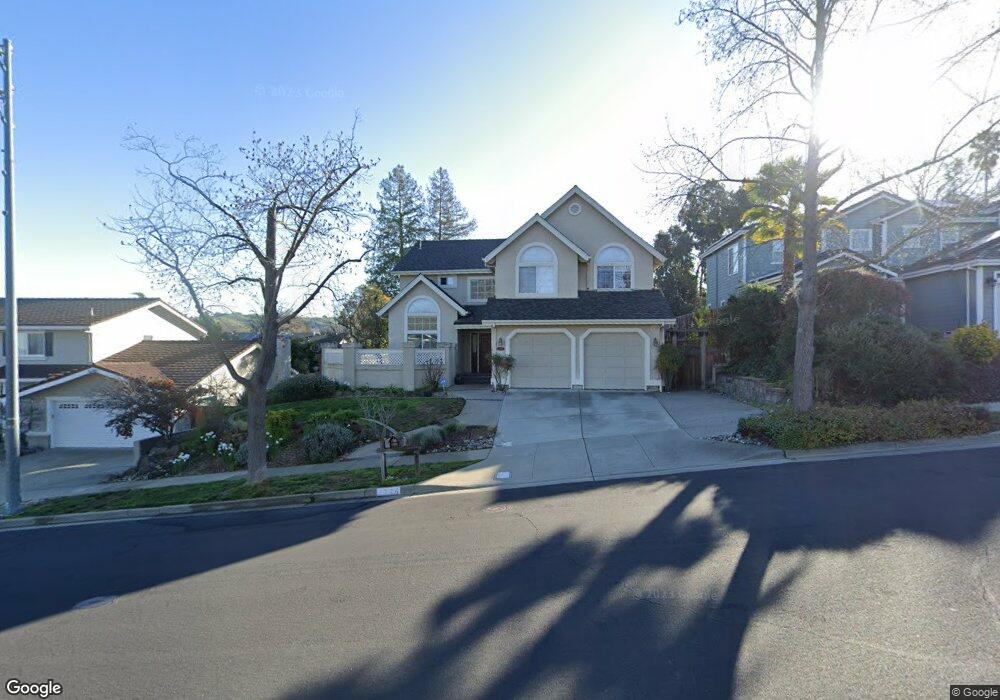
5744 San Carlos Way Pleasanton, CA 94566
Mission Park NeighborhoodEstimated Value: $1,792,984 - $1,887,000
4
Beds
3
Baths
2,333
Sq Ft
$787/Sq Ft
Est. Value
About This Home
This home is located at 5744 San Carlos Way, Pleasanton, CA 94566 and is currently estimated at $1,836,496, approximately $787 per square foot. 5744 San Carlos Way is a home located in Alameda County with nearby schools including Phoebe Apperson Hearst Elementary School, Pleasanton Middle School, and Foothill High School.
Ownership History
Date
Name
Owned For
Owner Type
Purchase Details
Closed on
Jan 14, 2012
Sold by
Burks Jonathan P and Burks Gretchen
Bought by
Izuhara Tomoyuki and Izuhara Beni
Current Estimated Value
Home Financials for this Owner
Home Financials are based on the most recent Mortgage that was taken out on this home.
Original Mortgage
$475,000
Interest Rate
3.98%
Mortgage Type
New Conventional
Purchase Details
Closed on
Oct 4, 2010
Sold by
Snow Michael and Snow Lauren
Bought by
Burks Jonathan P and England Gretchen
Home Financials for this Owner
Home Financials are based on the most recent Mortgage that was taken out on this home.
Original Mortgage
$600,000
Interest Rate
4.26%
Mortgage Type
New Conventional
Purchase Details
Closed on
Jun 17, 2008
Sold by
Snow Michael Scott and Snow Lauren Sue
Bought by
Snow Michael and Snow Lauren
Create a Home Valuation Report for This Property
The Home Valuation Report is an in-depth analysis detailing your home's value as well as a comparison with similar homes in the area
Home Values in the Area
Average Home Value in this Area
Purchase History
| Date | Buyer | Sale Price | Title Company |
|---|---|---|---|
| Izuhara Tomoyuki | $745,000 | Stewart Title Guaranty Co | |
| Burks Jonathan P | $770,000 | Chicago Title Company | |
| Snow Michael | -- | None Available |
Source: Public Records
Mortgage History
| Date | Status | Borrower | Loan Amount |
|---|---|---|---|
| Previous Owner | Izuhara Tomoyuki | $475,000 | |
| Previous Owner | Burks Jonathan P | $600,000 |
Source: Public Records
Tax History Compared to Growth
Tax History
| Year | Tax Paid | Tax Assessment Tax Assessment Total Assessment is a certain percentage of the fair market value that is determined by local assessors to be the total taxable value of land and additions on the property. | Land | Improvement |
|---|---|---|---|---|
| 2025 | $10,739 | $928,711 | $280,713 | $654,998 |
| 2024 | $10,739 | $910,370 | $275,211 | $642,159 |
| 2023 | $10,615 | $899,385 | $269,815 | $629,570 |
| 2022 | $10,055 | $874,751 | $264,525 | $617,226 |
| 2021 | $9,796 | $857,467 | $259,340 | $605,127 |
| 2020 | $9,671 | $855,610 | $256,683 | $598,927 |
| 2019 | $9,787 | $838,840 | $251,652 | $587,188 |
| 2018 | $9,589 | $822,397 | $246,719 | $575,678 |
| 2017 | $9,342 | $806,275 | $241,882 | $564,393 |
| 2016 | $8,625 | $790,467 | $237,140 | $553,327 |
| 2015 | $8,463 | $778,598 | $233,579 | $545,019 |
| 2014 | $8,613 | $763,348 | $229,004 | $534,344 |
Source: Public Records
Map
Nearby Homes
- 5363 Sonoma Dr
- 573 Junipero St
- 116 Mission Dr
- 540 Hamilton Way
- 6536 Hanover Ct
- 4726 Arlene Place
- 1189 Lund Ranch Rd
- 588 E Angela St
- 825 Abbie St
- 4525 Entrada Ct
- 68 Peters Ave Unit 6
- 789 E Angela St
- 4655 Augustine St
- 423 Del Sol Ave
- 466 Rose Ave
- 1225 Royal Creek Ct
- 786 Bonita Ave
- 4253 Mirador Dr
- 6745 Alisal St
- 1525 Whispering Oaks Way
- 5768 San Carlos Way
- 5722 San Carlos Way
- 5707 San Luis Ct
- 5719 San Luis Ct
- 5702 San Carlos Way
- 5895 San Juan Way
- 5889 San Juan Way
- 5747 San Carlos Way
- 5725 San Carlos Way
- 5769 San Carlos Way
- 5877 San Juan Way
- 5639 San Carlos Way
- 5691 San Luis Ct
- 5674 San Carlos Way
- 5855 San Juan Way
- 5783 San Carlos Way
- 5724 San Luis Ct
- 5645 San Carlos Way Unit 4
- 5847 San Juan Way
- 5665 San Luis Ct