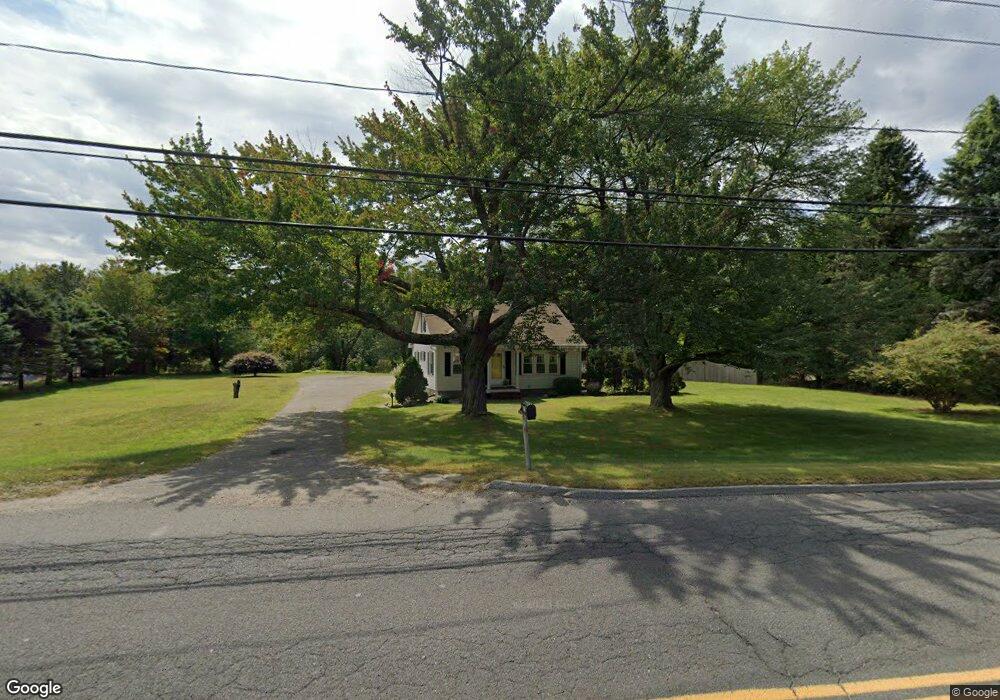
575 Fuller Rd Chicopee, MA 01020
Chicopee Falls NeighborhoodEstimated Value: $296,000 - $341,000
3
Beds
1
Bath
1,288
Sq Ft
$251/Sq Ft
Est. Value
About This Home
This home is located at 575 Fuller Rd, Chicopee, MA 01020 and is currently estimated at $322,849, approximately $250 per square foot. 575 Fuller Rd is a home located in Hampden County with nearby schools including Litwin Elementary School, Bellamy Middle School, and Chicopee High School.
Ownership History
Date
Name
Owned For
Owner Type
Purchase Details
Closed on
Apr 5, 2004
Sold by
Lempke Earline R
Bought by
Earline R Lempke T and Lempke Earline R
Current Estimated Value
Purchase Details
Closed on
Jan 18, 1980
Bought by
Earline R Lempke T
Create a Home Valuation Report for This Property
The Home Valuation Report is an in-depth analysis detailing your home's value as well as a comparison with similar homes in the area
Home Values in the Area
Average Home Value in this Area
Purchase History
| Date | Buyer | Sale Price | Title Company |
|---|---|---|---|
| Earline R Lempke T | -- | -- | |
| Earline R Lempke T | -- | -- |
Source: Public Records
Mortgage History
| Date | Status | Borrower | Loan Amount |
|---|---|---|---|
| Previous Owner | Earline R Lempke T | $30,000 | |
| Previous Owner | Earline R Lempke T | $31,000 | |
| Previous Owner | Earline R Lempke T | $29,000 |
Source: Public Records
Tax History
| Year | Tax Paid | Tax Assessment Tax Assessment Total Assessment is a certain percentage of the fair market value that is determined by local assessors to be the total taxable value of land and additions on the property. | Land | Improvement |
|---|---|---|---|---|
| 2025 | $4,319 | $284,900 | $131,900 | $153,000 |
| 2024 | $4,100 | $277,800 | $129,500 | $148,300 |
| 2023 | $3,841 | $253,500 | $118,000 | $135,500 |
| 2022 | $3,750 | $220,700 | $102,600 | $118,100 |
| 2021 | $3,541 | $201,100 | $93,500 | $107,600 |
| 2020 | $3,462 | $198,300 | $97,700 | $100,600 |
| 2019 | $3,436 | $191,300 | $97,700 | $93,600 |
| 2018 | $3,615 | $182,200 | $93,200 | $89,000 |
| 2017 | $3,201 | $184,900 | $83,800 | $101,100 |
| 2016 | $3,069 | $181,500 | $83,800 | $97,700 |
| 2015 | $3,103 | $176,900 | $83,800 | $93,100 |
| 2014 | $1,551 | $176,900 | $83,800 | $93,100 |
Source: Public Records
Map
Nearby Homes
- 66 Bromont St
- 74 Woodstock St
- 41 Oakhill Cir Unit 41
- 30 Butler Ave
- 70 Chateaugay St
- 251 Edendale St
- 147 Bowles Park
- 461 Sheridan St
- 156 East St
- 104 Chateaugay St
- 238 E Main St
- 225 Osborne Terrace
- 181 Beauchamp Terrace
- 80 Jean Dr
- 585 Sheridan St Unit 46
- 26 Belcher St
- 23 Jackson St
- 93 Grochmal Ave Unit 12
- 95 Washington St
- 101 Huntington Ave