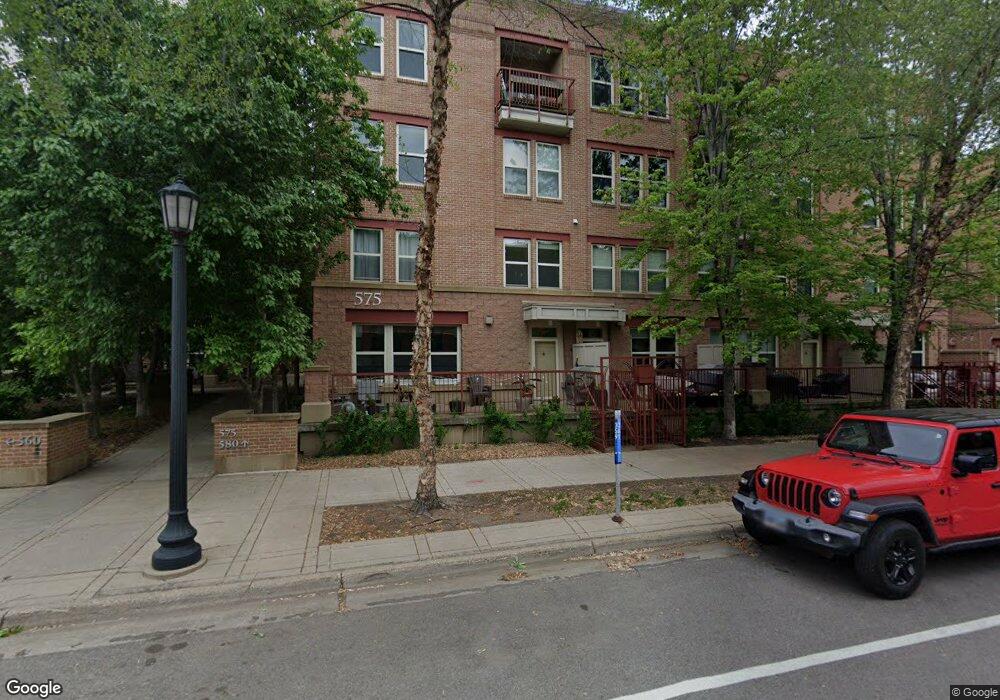
575 N 1st St Unit 107 Minneapolis, MN 55401
North Loop NeighborhoodEstimated Value: $391,000 - $470,000
2
Beds
2
Baths
1,360
Sq Ft
$311/Sq Ft
Est. Value
About This Home
This home is located at 575 N 1st St Unit 107, Minneapolis, MN 55401 and is currently estimated at $423,279, approximately $311 per square foot. 575 N 1st St Unit 107 is a home located in Hennepin County with nearby schools including Webster Elementary, Northeast Middle School, and Thomas Edison High School.
Ownership History
Date
Name
Owned For
Owner Type
Purchase Details
Closed on
Feb 9, 2021
Sold by
Lepak David M and Odegard Justin
Bought by
Nielsen Jenna
Current Estimated Value
Home Financials for this Owner
Home Financials are based on the most recent Mortgage that was taken out on this home.
Original Mortgage
$382,500
Outstanding Balance
$341,808
Interest Rate
2.65%
Mortgage Type
New Conventional
Estimated Equity
$81,471
Purchase Details
Closed on
Feb 10, 2012
Sold by
Frohling John C
Bought by
Lepak David and Lepak Colleen M
Home Financials for this Owner
Home Financials are based on the most recent Mortgage that was taken out on this home.
Original Mortgage
$150,750
Interest Rate
3.87%
Mortgage Type
New Conventional
Purchase Details
Closed on
Jul 28, 2003
Sold by
Kaiser Andrew
Bought by
Frohling John
Purchase Details
Closed on
Jul 26, 2001
Sold by
Heritage Renovations Llc
Bought by
Kaiser Andrew J
Create a Home Valuation Report for This Property
The Home Valuation Report is an in-depth analysis detailing your home's value as well as a comparison with similar homes in the area
Home Values in the Area
Average Home Value in this Area
Purchase History
| Date | Buyer | Sale Price | Title Company |
|---|---|---|---|
| Nielsen Jenna | $425,000 | Trademark Title Services Inc | |
| Lepak David | $201,000 | Regency Title Inc | |
| Frohling John | $290,000 | -- | |
| Kaiser Andrew J | $229,962 | -- |
Source: Public Records
Mortgage History
| Date | Status | Borrower | Loan Amount |
|---|---|---|---|
| Open | Nielsen Jenna | $382,500 | |
| Previous Owner | Lepak David | $150,750 |
Source: Public Records
Tax History Compared to Growth
Tax History
| Year | Tax Paid | Tax Assessment Tax Assessment Total Assessment is a certain percentage of the fair market value that is determined by local assessors to be the total taxable value of land and additions on the property. | Land | Improvement |
|---|---|---|---|---|
| 2024 | $5,808 | $400,000 | $112,000 | $288,000 |
| 2023 | $5,122 | $394,000 | $112,000 | $282,000 |
| 2022 | $5,164 | $382,500 | $102,000 | $280,500 |
| 2021 | $4,773 | $368,000 | $92,000 | $276,000 |
| 2020 | $5,173 | $361,000 | $55,000 | $306,000 |
| 2019 | $4,950 | $361,000 | $27,500 | $333,500 |
| 2018 | $4,623 | $337,500 | $27,500 | $310,000 |
| 2017 | $4,366 | $293,000 | $27,500 | $265,500 |
| 2016 | $4,150 | $272,000 | $27,500 | $244,500 |
| 2015 | $3,828 | $242,500 | $27,500 | $215,000 |
| 2014 | -- | $208,500 | $27,500 | $181,000 |
Source: Public Records
Map
Nearby Homes
- 580 N 2nd St Unit 300
- 560 N 2nd St Unit 410
- 560 N 2nd St Unit 114
- 645 N 1st St Unit 305
- 645 N 1st St Unit 125
- 545 N 1st St Unit 125
- 545 N 1st St Unit 123
- 660 N 2nd St Unit 303
- 680 N 2nd St Unit 403
- 618 Washington Ave N Unit 304
- 401 N 2nd St Unit 504
- 401 N 2nd St Unit 623
- 700 Washington Ave N Unit 523
- 700 Washington Ave N Unit 627
- 700 Washington Ave N Unit 507
- 700 Washington Ave N Unit 207
- 700 Washington Ave N Unit 615
- 400 N 1st St Unit 502
- 400 N 1st St Unit 611
- 718 Washington Ave N Unit 612
- 575 N 1st St Unit 407
- 575 N 1st St Unit 406
- 575 N 1st St Unit 405
- 575 N 1st St Unit 404
- 575 N 1st St Unit 403
- 575 N 1st St Unit 402
- 575 N 1st St Unit 401
- 575 N 1st St Unit 400
- 575 N 1st St Unit 302
- 575 N 1st St Unit 301
- 575 N 1st St Unit 300
- 575 N 1st St Unit 109
- 575 N 1st St Unit 111
- 575 N 1st St Unit 115
- 575 N 1st St Unit 117
- 575 N 1st St Unit 119
- 575 N 1st St Unit 121
- 575 N 1st St Unit 123
- 575 N 1st St Unit 101
- 575 N 1st St Unit 103