
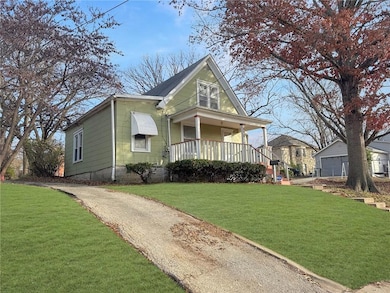
575 S Crescent Ave Independence, MO 64053
Mount Washington NeighborhoodEstimated payment $567/month
Highlights
- Very Popular Property
- No HOA
- Attic Fan
- Traditional Architecture
- Window Unit Cooling System
- Forced Air Heating System
About This Home
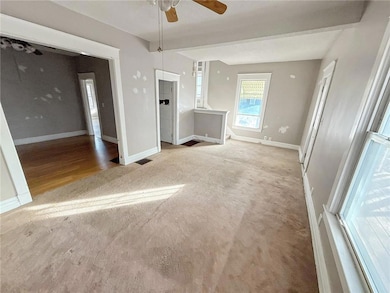
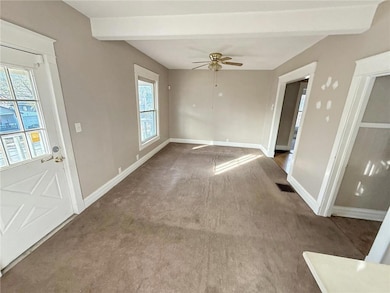
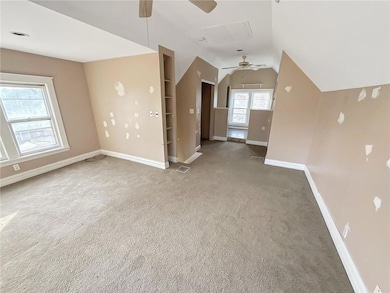
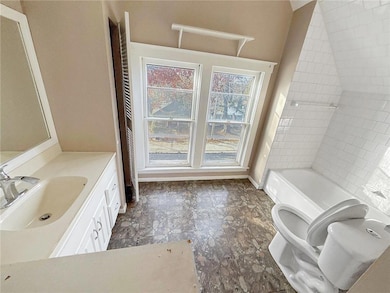
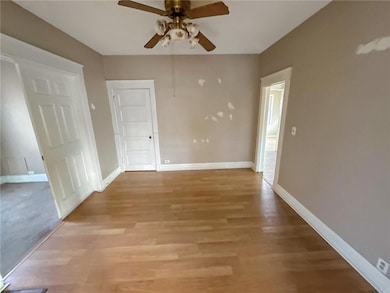
Come check out this charming home ready for your personal touches! As you step into this inviting 2-bed, 2-bath home offering a bright, open layout and flexible spaces perfect for relaxing or entertaining. A comfortable primary suite, generous secondary bedroom, and well-proportioned living areas create a wonderful place to make your own
Listing Agent
REO Xpress LLC Brokerage Phone: 314-742-3920 License #2009013939 Listed on: 12/07/2025

Home Details
Home Type
- Single Family
Est. Annual Taxes
- $1,195
Lot Details
- 8,276 Sq Ft Lot
Parking
- Off-Street Parking
Home Design
- Traditional Architecture
- Composition Roof
Interior Spaces
- 1,412 Sq Ft Home
- 1.5-Story Property
- Attic Fan
Bedrooms and Bathrooms
- 2 Bedrooms
- 2 Full Bathrooms
Unfinished Basement
- Basement Fills Entire Space Under The House
- Stone or Rock in Basement
Utilities
- Window Unit Cooling System
- Forced Air Heating System
Community Details
- No Home Owners Association
- North Evanston Subdivision
Listing and Financial Details
- Assessor Parcel Number 14-840-21-22-00-0-00-000
- $0 special tax assessment
Map
Home Values in the Area
Average Home Value in this Area
Tax History
| Year | Tax Paid | Tax Assessment Tax Assessment Total Assessment is a certain percentage of the fair market value that is determined by local assessors to be the total taxable value of land and additions on the property. | Land | Improvement |
|---|---|---|---|---|
| 2025 | $1,267 | $16,333 | $4,454 | $11,879 |
| 2024 | $1,267 | $17,765 | $2,141 | $15,624 |
| 2023 | $1,236 | $17,765 | $1,324 | $16,441 |
| 2022 | $941 | $12,350 | $1,643 | $10,707 |
| 2021 | $937 | $12,350 | $1,643 | $10,707 |
| 2020 | $919 | $11,793 | $1,643 | $10,150 |
| 2019 | $905 | $11,793 | $1,643 | $10,150 |
| 2018 | $811 | $10,263 | $1,430 | $8,833 |
| 2017 | $826 | $10,263 | $1,430 | $8,833 |
| 2016 | $826 | $10,210 | $1,174 | $9,036 |
| 2014 | $785 | $9,913 | $1,140 | $8,773 |
Property History
| Date | Event | Price | List to Sale | Price per Sq Ft |
|---|---|---|---|---|
| 12/07/2025 12/07/25 | For Sale | $89,000 | -- | $63 / Sq Ft |
Purchase History
| Date | Type | Sale Price | Title Company |
|---|---|---|---|
| Trustee Deed | $90,169 | None Listed On Document | |
| Warranty Deed | $37,000 | Alpha Title Llc | |
| Quit Claim Deed | -- | None Available | |
| Warranty Deed | -- | Heart Of America Title Inc | |
| Warranty Deed | -- | Old Republic Title |
Mortgage History
| Date | Status | Loan Amount | Loan Type |
|---|---|---|---|
| Previous Owner | $49,386 | FHA | |
| Previous Owner | $40,531 | FHA |
Source: Heartland MLS
MLS Number: 2591352
APN: 14-840-21-22-00-0-00-000
Disclaimer: Certain information contained herein is derived from information provided by parties other than Homes.com. All information provided is deemed reliable, but is not guaranteed to be accurate and should be independently verified.
![]() Based on information submitted to the MLS GRID as of [see last changed date above]. All data is obtained from various sources and may not have been verified by broker or MLS GRID. Supplied Open House Information is subject to change without notice. All information should be independently reviewed and verified for accuracy. Properties may or may not be listed by the office/agent presenting the information. Some IDX listings have been excluded from this website. Prices displayed on all Sold listings are the Last Known Listing Price and may not be the actual selling price.
Based on information submitted to the MLS GRID as of [see last changed date above]. All data is obtained from various sources and may not have been verified by broker or MLS GRID. Supplied Open House Information is subject to change without notice. All information should be independently reviewed and verified for accuracy. Properties may or may not be listed by the office/agent presenting the information. Some IDX listings have been excluded from this website. Prices displayed on all Sold listings are the Last Known Listing Price and may not be the actual selling price.
Listing Information presented by local MLS brokerage: TEN-X, INC., local REALTOR®- Arlene Richardson - (888)952-6393
The Digital Millennium Copyright Act of 1998, 17 U.S.C. § 512 (the “DMCA”) provides recourse for copyright owners who believe that material appearing on the Internet infringes their rights under U.S. copyright law. If you believe in good faith that any content or material made available in connection with our website or services infringes your copyright, you (or your agent) may send us a notice requesting that the content or material be removed, or access to it blocked.
Notices must be sent in writing by email to DMCAnotice@MLSGrid.com.
The DMCA requires that your notice of alleged copyright infringement include the following information:
(1) description of the copyrighted work that is the subject of claimed infringement;
(2) description of the alleged infringing content and information sufficient to permit us to locate the content;
(3) contact information for you, including your address, telephone number and email address;
(4) a statement by you that you have a good faith belief that the content in the manner complained of is not authorized by the copyright owner, or its agent, or by the operation of any law;
(5) a statement by you, signed under penalty of perjury, that the information in the notification is accurate and that you have the authority to enforce the copyrights that are claimed to be infringed; and
(6) a physical or electronic signature of the copyright owner or a person authorized to act on the copyright owner’s behalf. Failure to include all of the above information may result in the delay of the processing of your complaint.
- 573 S Crescent Ave
- 572 S Crescent Ave
- 534 S Evanston Ave
- 641 S Arlington Ave
- 611 S Overton Ave
- 9707 E Wilson Rd
- 526 S Brookside Ave
- 726 S Hawthorne Ave
- 826 S Arlington Ave
- 804 S Home Ave
- 9311 E 9th St S
- 549 S Cedar Ave
- 620 S Huttig Ave
- 508 S Huttig Ave
- 9535 E Winner Rd
- 104 S Oxford Ave
- 100 S Oxford Ave
- 212 S Huttig Ave
- 626 S Hardy Ave
- 115 N Arlington Ave
- 522 S Hardy Ave
- 1105 S Brookside Ave
- 10503 E Scarritt Ave
- 332 N Cedar Ave
- 525 Stone Arch Dr
- 530 Sundown Dr
- 11308 E Aaron Ln Unit 11308
- 1401 S Cunningham St
- 11222 E 20th St S
- 1409-1415 W Maple Ave
- 2624 S Evanston Ave
- 1011 N Cottage St
- 11330 E 24th St S
- 1603 W 24th Terrace S
- 120 W Elizabeth St
- 1020 S Pleasant St Unit B
- 5852 E 20th St
- 3405 S Oxford Ave Unit 3405 Oxford Ave
- 3302 S Sterling Ave
- 5242 Lyon Ave