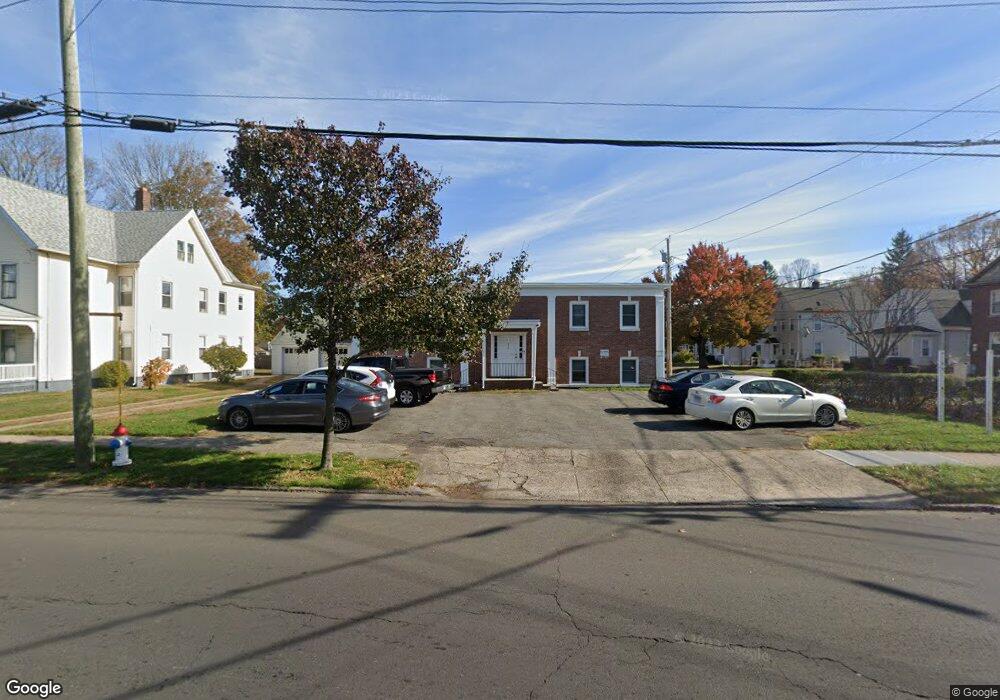
575 Savin Ave West Haven, CT 06516
West Haven Center NeighborhoodEstimated Value: $673,534
4
Beds
2
Baths
4,200
Sq Ft
$160/Sq Ft
Est. Value
About This Home
This home is located at 575 Savin Ave, West Haven, CT 06516 and is currently estimated at $673,534, approximately $160 per square foot. 575 Savin Ave is a home located in New Haven County with nearby schools including Carrigan 5/6 Intermediate School, Harry M. Bailey Middle School, and West Haven High School.
Ownership History
Date
Name
Owned For
Owner Type
Purchase Details
Closed on
Apr 9, 2021
Sold by
Murillo Camilo E
Bought by
Murvac Properties Llc
Current Estimated Value
Purchase Details
Closed on
Sep 25, 1998
Sold by
Conn Empl Asstnc Prgrm
Bought by
Murillo Bamilo E
Home Financials for this Owner
Home Financials are based on the most recent Mortgage that was taken out on this home.
Original Mortgage
$200,000
Interest Rate
10%
Mortgage Type
Commercial
Create a Home Valuation Report for This Property
The Home Valuation Report is an in-depth analysis detailing your home's value as well as a comparison with similar homes in the area
Home Values in the Area
Average Home Value in this Area
Purchase History
| Date | Buyer | Sale Price | Title Company |
|---|---|---|---|
| Murvac Properties Llc | -- | None Available | |
| Murvac Properties Llc | -- | None Available | |
| Murillo Bamilo E | $208,000 | -- | |
| Murillo Bamilo E | $208,000 | -- |
Source: Public Records
Mortgage History
| Date | Status | Borrower | Loan Amount |
|---|---|---|---|
| Previous Owner | Murillo Bamilo E | $200,000 | |
| Previous Owner | Murillo Bamilo E | $129,272 |
Source: Public Records
Tax History Compared to Growth
Tax History
| Year | Tax Paid | Tax Assessment Tax Assessment Total Assessment is a certain percentage of the fair market value that is determined by local assessors to be the total taxable value of land and additions on the property. | Land | Improvement |
|---|---|---|---|---|
| 2025 | $8,919 | $258,300 | $66,710 | $191,590 |
| 2024 | $10,081 | $207,760 | $63,560 | $144,200 |
| 2023 | $9,663 | $207,760 | $63,560 | $144,200 |
| 2022 | $9,474 | $207,760 | $63,560 | $144,200 |
| 2021 | $9,474 | $207,760 | $63,560 | $144,200 |
| 2020 | $10,934 | $216,650 | $63,560 | $153,090 |
| 2019 | $10,544 | $216,650 | $63,560 | $153,090 |
| 2018 | $10,453 | $216,650 | $63,560 | $153,090 |
| 2017 | $9,892 | $216,650 | $63,560 | $153,090 |
| 2016 | $9,871 | $216,650 | $63,560 | $153,090 |
| 2015 | $9,067 | $224,700 | $63,560 | $161,140 |
| 2014 | $9,010 | $224,700 | $63,560 | $161,140 |
Source: Public Records
Map
Nearby Homes